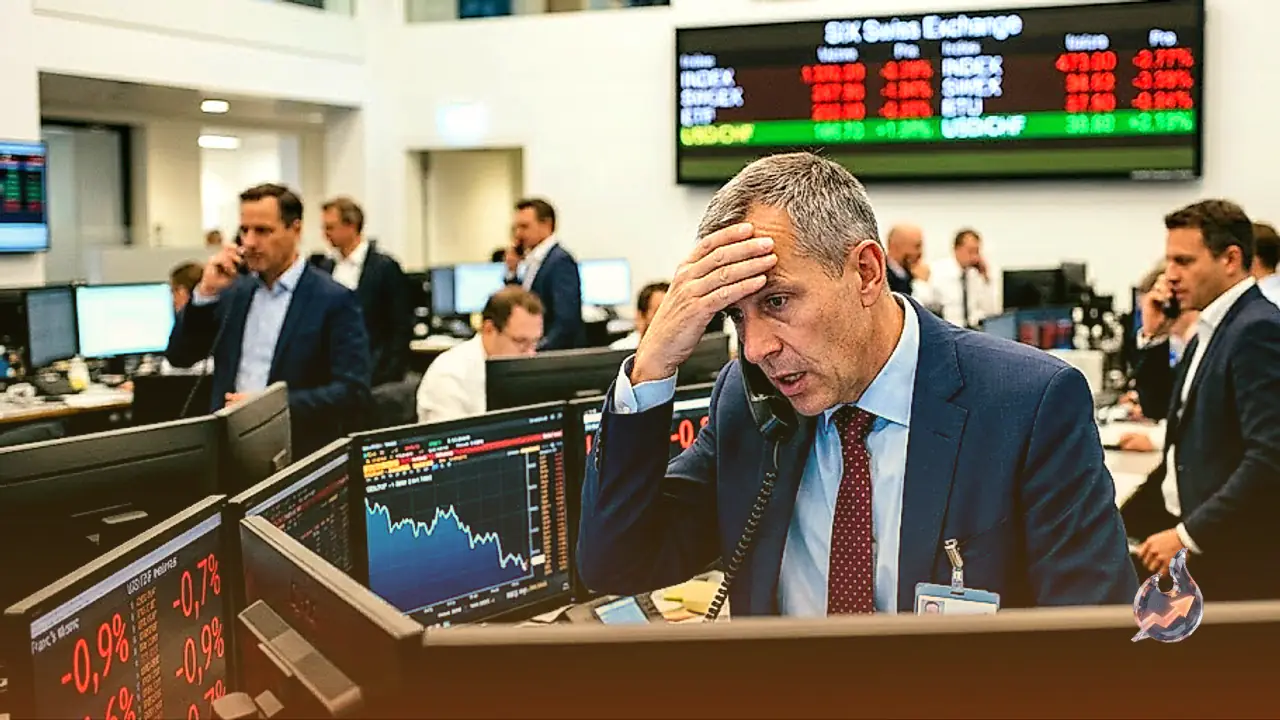

























Gold is concluding the final stretch of September under noticeable downward pressure, hovering relatively close to its annual low situated in the $3,940 territory. The precious metal received a short-lived lift on Wednesday, climbing aggressively toward a peak near $4,220 during the early hours of the American trading session. However, the upward momentum faded rapidly, causing bullion to reverse course and slip into negative territory for the day. While sellers subsequently pushed spot prices back toward the $4,150 zone per troy ounce, live market data shows the yellow metal changing hands around $4,180.
Macroeconomic Data Lowers Federal Reserve Rate Hike Odds
The intraday swing and subsequent pullback in bullion were triggered by a sequence of positive economic reports released in the United States. These figures significantly altered interest rate expectations by dampening the probability of a rate hike at the upcoming Federal Reserve meeting in October. At the start of the week, financial markets had priced in a greater than 70% chance of a policy tightening, but those odds dropped steeply to roughly 40% following the data releases.
The macroeconomic reports confirmed solid economic momentum alongside easing price pressures. Second-quarter annualized economic expansion, gauged by Gross Domestic Product, was revised upward to 2.2% from the initial estimate of 1.5%. Furthermore, the private employment landscape displayed resilience, with the ADP Employment Change report revealing the addition of 90K private sector positions during the month. Crucially, the Personal Consumption Expenditures Price Index, recognized as the preferred inflation gauge of the Federal Reserve, came in softer than anticipated for August, remaining steady at 3.4%. This moderating inflationary environment initially gave gold buyers a reason to step forward.
Treasury Yields at Multi-Decade Peaks Provide Dollar Advantage
Despite the cooling inflation figures and diminishing rate-hike expectations, gold encountered significant resistance from the sovereign debt market. The yield on the benchmark 10-year US Treasury note surged to fresh multi-decade highs, reaching 5.30%. The persistently massive volume of US government debt requires a continuous and heavy issuance of Treasury securities. Because market participants must acquire US Dollars to purchase these paper assets, the greenback preserved its firm footing across global currency markets.
Given that gold is a non-yielding asset, the opportunity cost of holding metal increases substantially when risk-free sovereign debt yields 5.30%. This dynamic allowed the US Dollar to stage a recovery and counter the early bullion rally, trimming earlier losses as gold retreated from the key $4,200 psychological barrier.
Technical Indicators Point to Short-Term Weakness and Long-Term Base
From a chartist perspective, gold displays underlying softness over the immediate horizon, yet its broader, long-term framework indicates structural stability with upside potential. On monthly timeframes, XAU/USD continues to carve out a pattern of higher lows positioned comfortably above a rising 20-month Simple Moving Average, signaling that the secular bull trend remains intact.
Daily technical readings reflect the current consolidation and corrective phase. The 14-day Relative Strength Index sits at 34, reflecting subdued momentum near oversold boundaries. The MACD indicator prints at -55.44 against a signal line of -26.03, generating a negative histogram of -29.41. Trend averages highlight immediate overhead hurdles, with the 20-day Exponential Moving Average at $4,337, the 50-day EMA at $4,359, and the 200-day EMA at $4,438, alongside a 50-day SMA at $4,363 and a 200-day SMA at $4,555. With the 50-day EMA crossing below the 200-day EMA, a technical death cross remains active. Daily Bollinger Bands span from $4,170 to $4,557 with a median at $4,364. Crucial trading levels place the pivot at $4,203, initial resistance R1 at $4,228 and R2 at $4,276, while immediate support S1 aligns at $4,155 and S2 at $4,130, against a broader 52-week trading corridor of $3,821 to $5,586.
Strait of Hormuz Traffic, Oil Dynamics, and Political Landscape
The decisive catalyst for bullion over the coming weeks will likely hinge on the Middle East conflict and the trajectory of international crude oil prices. While geopolitical hostilities have appeared intractable, market participants are noting that maritime transit through the strategically vital Strait of Hormuz has recovered to approximately 80% of its pre-war volume. Provided regional tensions do not experience a fresh escalation, this maritime normalization suggests oil prices are poised to ease further.
Domestic political factors in the United States also introduce a stabilizing influence. With US mid-term elections approaching rapidly, President Donald Trump is widely anticipated to maintain a cautious stance, avoiding disruptive policy shocks over the next few months. As long as geopolitical frictions remain in play, the US Dollar will find reasons to advance against bullion. However, once crude oil prices decline and broader regional security anxieties subside, market conditions are expected to swing decisively in favor of gold.
Broader Market Movements Across Forex and Digital Assets
Cross-asset performance on Wednesday mirrored the complex interaction between monetary policy and currency flows. In the currency space, AUD/USD dropped to two-month lows near 0.6950 during the Asian session, penalized by lower-than-projected Australian underlying CPI data for August, which reduced expectations for additional interest rate increases by the Reserve Bank of Australia, while Chinese manufacturing PMI data offered no counterweight.
USD/JPY remained suppressed beneath 157.00 in Asian dealings, supported by expectations of tighter Bank of Japan policy and potential currency intervention, which overshadowed weak Japanese industrial production and retail sales figures. In Europe, EUR/USD touched 1.1312, marking its lowest level since May 2025 and trading well below its January high of 1.2082 due to dollar resilience, regional geopolitical concerns, and energy price sensitivity, even as a fresh Eurozone inflation print offered a potential cushion. In the cryptocurrency complex, Bitcoin remained subdued, defending its immediate $83,000 support, while Ethereum traded between $2,600 and $2,700, and Ripple changed hands near $1.50.