





















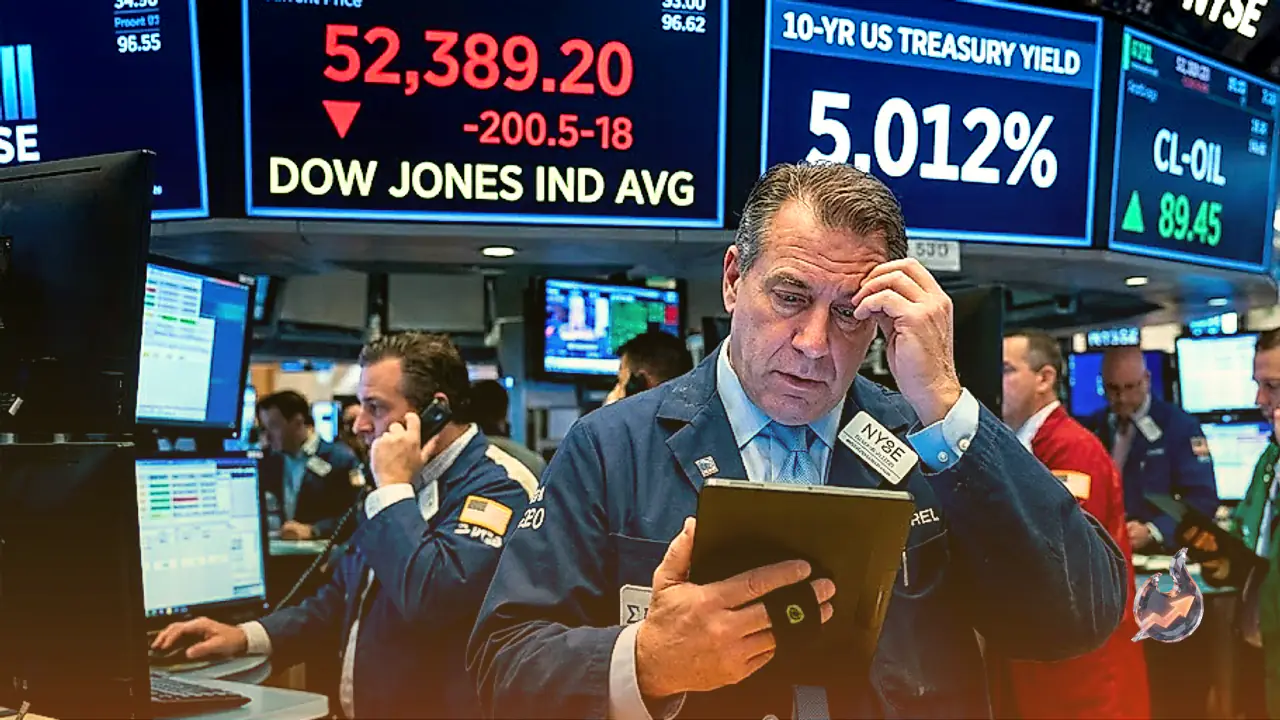

A relentless climb in United States government bond yields has placed renewed pressure on equity benchmarks, pulling the Dow Jones Industrial Average down by roughly 200 points to trade just beneath the 52,400 mark. While daily market headlines have frequently highlighted developments in artificial intelligence and the tech-heavy Nasdaq Composite, which dropped around 1%, the drag on the 30-stock Dow stems from far more straightforward financial mechanics. Treasury yields have pushed to their highest thresholds since 2023, and a risk-free government bond returning 5% fundamentally alters portfolio allocation away from common equities.
Benchmark 10-Year Yield Crosses 5%, Shifting Borrowing Costs
The yield on the 10-year Treasury note has settled just above the critical 5% barrier. Because this benchmark anchors consumer and corporate lending across the American economy, its surge directly ripples through household finances. The average 30-year residential fixed mortgage rate has climbed to 6.76%, up noticeably from 6.15% recorded at the start of the year. Auto loans, consumer credit card balances, and corporate borrowing lines are all forced to adjust higher in tandem. Furthermore, the yield gap reshapes equity valuation fundamentals: while the primary exchange-traded fund tracking the Dow delivers an annual dividend yield near 1.4%, the federal government is now offering a guaranteed 5% return to borrow capital across a ten-year horizon.
Housing Supply Chains Face Softening Demand
The weight of these elevated borrowing benchmarks has landed squarely on the homebuilding and renovation names within the index. Retailers and suppliers such as Home Depot (HD) and Sherwin-Williams (SHW) provide timber, coatings, and building supplies to a consumer base increasingly reluctant to relocate or finance property improvements at mortgage rates of 6.76%. In effect, fixed-income markets have executed credit tightening across the residential sector just two days before the central bank convenes to cast its policy vote. The 10-year yield previously reached the 5% threshold in October 2023, though it sustained that level for merely a single trading session.
Artificial Intelligence Scrutiny and Semiconductor Retracement
Technological sentiment experienced its own reset following developments over the weekend. The chief executive of Anthropic issued an extended essay arguing that artificial intelligence developers should moderate the speed at which their top-tier models expand in capability. That cautious stance was publicly endorsed by the leadership of OpenAI as well as Elon Musk, alongside OpenAI confirming that an initial public offering would not take place this year. Wall Street interpreted these combined declarations as an early warning of moderating capital expenditure on specialized processors and data facility expansions, the exact investment cycle that has supported broader equity momentum for three years.
Nvidia (NVDA), the sole semiconductor designer present in the Dow index, fell approximately 3%. Broader industry peers outside the index recorded steeper declines, with Broadcom (AVGO), Advanced Micro Devices (AMD), Intel (INTC), and Marvell Technology (MRVL) shedding between 4% and 7%. By contrast, large-scale infrastructure buyers in the Dow such as Microsoft (MSFT) and Amazon (AMZN) held their ground relatively better since their operations absorb rather than supply these components. The rapid alignment among three major industry rivals within a single 24-hour span caught semiconductor investors off guard.
Crude Oil Spikes on Critical Pipeline Disruption
Energy supply worries escalated sharply after Saudi Arabia halted transit along its East-West pipeline on Friday in the wake of drone strikes. West Texas Intermediate (WTI) Crude Oil rose roughly 3% to settle above $103 per barrel, while international benchmark Brent crude crossed $108 per barrel. The transit corridor can transport up to 7 million barrels daily to the Red Sea, representing the Kingdom's primary alternate route since maritime navigation through the Strait of Hormuz effectively stopped in March. The pipeline was originally constructed precisely to circumvent reliance on maritime chokepoints, yet operational access to both channels has now been compromised.
Within the Dow's composition, higher energy costs represent a direct operating drag for the majority of members. Chevron (CVX) stands as the singular company in the index that benefits directly from ascending crude prices. Conversely, consumer giants like Walmart (WMT) and McDonald's (MCD) must navigate consumer wallets depleted by retail gasoline expenses, while equipment manufacturer Caterpillar (CAT) produces industrial machinery powered by diesel fuel. These energy spikes simultaneously distress the bond market, given that energy represents the majority of the divergence between headline consumer inflation at 3.4% and the core figure of 2.4%, with bond desks pricing headline risks aggressively.
Federal Reserve Policy Path and Dot Plot Risks
The Federal Reserve is scheduled to unveil its monetary policy verdict at 18:00 GMT on Wednesday. Interest rate futures contracts currently price in an approximate 90% probability of a 25-basis-point increase, which would push the federal funds target range from 3.50-3.75% up to 3.75-4.00%, marking the central bank's first rate increase since 2023. A hike mechanically increases the overnight borrowing costs that commercial banks pay, tightening liquidity throughout the financial system. Given that a 90% implied probability means the move is largely discounted by traders, the actual risk lies within the updated economic projections published concurrently.
The central bank's June forecasts envisioned rates settling at 3.8% by the end of this year, dropping to 3.6% next year, and normalizing near 3.4% by 2028, outlining a path of near-term tightening followed by future easing. However, bond yields have priced in repeated policy tightening, with surveyed economists anticipating at least one additional hike by March. Wednesday's dot plot will reveal whether policymakers align with this hawkish market trajectory out to 2027. The post-meeting press conference at 18:30 GMT will provide critical guidance on which side will have to adjust expectations.
Several high-impact macroeconomic data points precede and follow the decision. August retail sales numbers arrive at 12:30 GMT on Wednesday, with consensus anticipating a 0.9% rebound after a 0.6% contraction. Because retail turnover is calculated in nominal dollars, an increase could simply reflect motorists paying higher fuel bills rather than genuine consumer expansion. The retail control group, which strips out volatile components like vehicle purchases, building materials, and retail gasoline, registered a 0.4% decline in the prior print and will provide clarity just hours before the rate vote. On Thursday at 12:30 GMT, housing starts and building permits data will outline how higher mortgage rates are impacting residential builders, followed by an address by a Federal Reserve governor on Friday at 07:30 GMT.
Technical Indicators and Live Market Posture
From a chart perspective, key technical boundaries remain firmly defined. To the upside, the early session peak just above 52,500 serves as immediate resistance. The primary barrier resides at the 50-day Exponential Moving Average (EMA) near 52,750, a level the index has failed to reclaim over three consecutive sessions after Friday's rebound stalled. Beyond that, the 53,000 round figure presents secondary resistance. On the downside, the intraday floor sits just above 52,250, while the crucial defensive support rests at Thursday's low near 52,000. A violation of that threshold exposes the late-July consolidation shelf near 51,500.
The prevailing technical bias remains negative while the 50-day EMA near 52,750 caps upward movement. The daily Stochastic Relative Strength Index (Stoch RSI) sits near 39 and points southward, suggesting bearish momentum still has room to expand, though a daily close above 53,000 would negate this downward setup. According to live market data, the Dow Jones (^DJI) settled down 0.18% at $51,683 against its prior close of $51,778. The benchmark trades within a 52-week envelope of $45,057 to $54,744, with volume tracking 1.89 times its 20-day mean. Live indicators show the 14-period RSI at 38 and the MACD at -358.88 against a -183.46 signal line. The 20-day EMA stands at $52,563, the 50-day EMA at $52,576, and the 200-day EMA at $50,275, maintaining a broad golden cross posture. Bollinger Bands trace a range from $51,418 to $54,204, while daily pivot points place resistance at $51,840 and immediate support at $51,511.
Structure of the Dow and Principles of Dow Theory
As one of the most established stock market measures in financial history, the Dow Jones Industrial Average tracks 30 leading United States corporations. Rather than weighting components by market capitalization, it operates on a price-weighted methodology, determined by summing share prices and dividing by an adjustment divisor currently set at 0.152. Established by Wall Street Journal founder Charles Dow, the index is often contrasted with broader benchmarks like the S&P 500 for its exclusive focus on 30 large conglomerates.
Index movements are driven by quarterly corporate earnings results across its constituents, alongside shifts in investor risk appetite prompted by domestic and international macroeconomic indicators. Because monetary policy set by the Federal Reserve dictates corporate debt servicing expenses, inflation readings and interest rate trajectories exert a massive influence over valuation multiples. The classic analytical framework known as Dow Theory posits that market trends should be verified by comparing the Dow Jones Industrial Average against the Dow Jones Transportation Average, requiring aligned movement alongside expanding volume to confirm a durable trend. The theory outlines three operational market phases: accumulation by institutional participants, subsequent public participation, and final distribution as smart money locks in gains. Institutional and retail investors typically gain diversified exposure to the 30-stock benchmark through exchange-traded funds like the SPDR Dow Jones Industrial Average ETF (DIA), as well as standardized futures, options contracts, and indexed mutual funds.
Broader Market Movements: Currencies, Gold, and Digital Assets
Cross-asset performance exhibited substantial shifts across global trading floors. In foreign exchange, the Australian dollar touched a one-and-a-half-week low near 0.7140 against the greenback during Asian trading, before consolidating just above the mid-0.7100 handle with a daily drop of nearly 0.25%. Concurrently, the dollar strengthened against the Japanese yen, climbing toward 154.00 as traders prepared for upcoming central bank meetings.
Precious metals faced intense headwinds, with gold sliding to test multi-week lows near $4,250 per ounce due to the combined strength in the US dollar and Treasury yields. Rebounding energy commodities and sticky wholesale inflation metrics have stoked expectations that central bankers will keep credit conditions restrictive. Conversely, major cryptocurrencies displayed resilience: Bitcoin traded higher near $77,884, while Ethereum and Ripple maintained support at $2,521 and $1.38, respectively. With Donald Trump voicing preferences for lower borrowing costs, the central bank's upcoming dot plot will test institutional policy independence amid persistent price pressures.