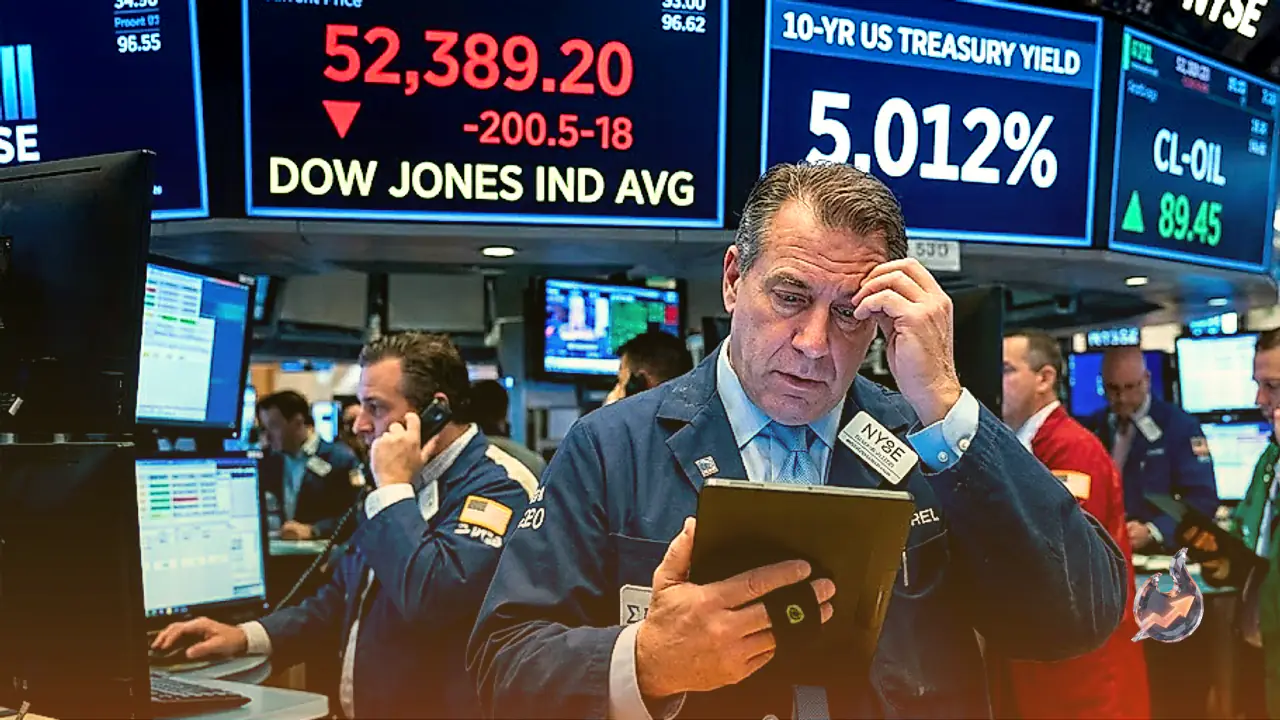
























Global energy markets witnessed renewed upward momentum as geopolitical turbulence across the Middle East triggered fresh buying interest in crude oil. West Texas Intermediate, the benchmark for US crude, overcame the volatility of the preceding session to push past the $99.00 per barrel mark during Tuesday's Asian trading hours. This upward move positions the commodity near its highest trading levels since May 21, which were recorded late last week. Market participants are increasingly factoring in the risk of supply disruptions across critical export routes, reinforcing a positive bias across crude contracts for a second consecutive session.
Military Strikes and Diplomatic Gridlock in the Region
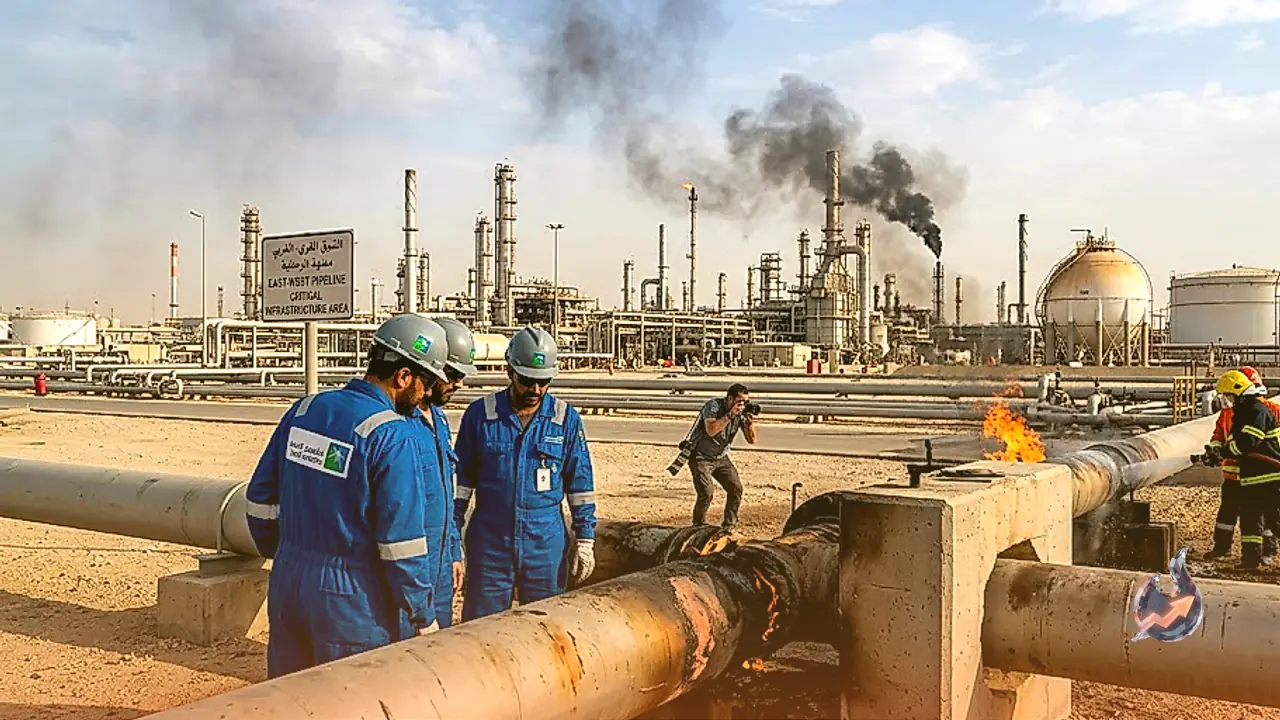
The geopolitical backdrop worsened following fresh military escalations over the weekend. Iran-backed Houthi forces operating from Yemen launched an extensive assault involving missiles and unmanned aerial drones directed at a Saudi military air base located in Khamis Mushait on Monday. This attack underscored the persistent vulnerabilities surrounding critical regional infrastructure and transit routes.
Compounding the security anxiety, Iranian Supreme National Security Council Secretary Mohsen Rezaei pushed back against any imminent return to negotiations with Washington. Rezaei stated that Tehran would refuse to enter diplomatic talks until its specified demands are fully met. This firm stance dampens expectations for any immediate negotiated ceasefire or diplomatic resolution to the conflict. Consequently, the geopolitical risk premium remains firmly embedded in energy prices, providing strong fundamental backing for continued crude strength.
Technical Indicators Point to Ongoing Bullish Trajectory
From a technical standpoint, the commodity gained significant traction after breaking above the crucial $91.00 horizontal threshold. That zone had previously marked the 61.8% Fibonacci retracement level of the downward move recorded between May and July. Clearing this hurdle served as an important technical signal for bullish traders looking to re-enter long positions. Momentum gauges corroborate this positive setup, with the Relative Strength Index hovering near 69 just below overbought territory. Concurrently, the Moving Average Convergence Divergence indicator remains in positive territory, reinforcing upside pressure as long as pricing stays anchored in the upper $90s range.
Looking at overhead targets, the next primary barrier stands near the prior cyclical peak around $107.23, which could restrict immediate advances unless breached with decisive trading volume. On the downside, initial support rests at the 78.6% retracement marker near $98.57. A deeper retracement would encounter the 61.8% level at $91.78, followed by the 50% retracement point around $87.01. Below that, the 100-day Simple Moving Average clusters near $85.39, offering an intermediate cushion ahead of deeper Fibonacci support zones at $82.24 and $76.33, before testing the cycle trough situated at $66.79.
Live market data shows crude oil trading at $100.30, easing 1.58% from its prior close of $101.91 within a 52-week range of $54.98 to $119.48 on volume measuring 0.88 times its 20-day average. Live technical indicators show the 14-day RSI at 64 and the MACD at 5.12 over a 4.34 signal line, yielding a positive histogram of 0.78. Moving averages highlight a sustained long-term uptrend supported by a golden cross, with the 20-day EMA at $94.81, 50-day EMA at $89.11, and 200-day EMA at $79.29, alongside a 50-day SMA of $86.40 and 200-day SMA of $80.68. The 20-day Bollinger Bands span $77.45 to $108.23 around a $92.84 midpoint, the 14-day ADX sits at 34 indicating active trend strength, and the Stochastic fast line stands at 72 against a 78 signal line. Volatility measured by the 14-day ATR is $4.27. Key pivot levels place the central pivot at $100.99, overhead resistance at R1 $102.79 and R2 $105.28, and downside support at S1 $98.50 and S2 $96.70.
Understanding the Drivers of WTI Crude Oil
West Texas Intermediate represents a primary global crude oil benchmark alongside Brent and Dubai Crude. Sourced within the United States, it is characterized as a light, sweet crude due to its low specific gravity and minimal sulfur content. These chemical properties make it relatively straightforward and cost-effective to refine into high-demand end products such as gasoline and diesel. Trading and physical delivery for WTI revolve around the storage and pipeline network in Cushing, Oklahoma, widely recognized as the pipeline crossroads of the world. Because of its liquidity and transparent trading mechanisms, WTI prices serve as a standard reference across financial news outlets and commercial contracts.
Pricing for WTI is governed by classic supply and demand fundamentals. Accelerating global economic activity typically boosts industrial and transportation fuel requirements, lifting prices, whereas periods of economic contraction soften overall consumption. Geopolitical friction, armed conflicts, and economic sanctions routinely interfere with production and export flows, introducing sudden supply shocks. Furthermore, the valuation of the US Dollar exerts an inverse influence on oil pricing. Because crude contracts are predominantly denominated in greenbacks, a depreciation in the dollar makes oil purchases more accessible for buyers using foreign currencies, stimulating international demand, whereas a strengthening dollar tends to weigh on consumption.
Impact of Inventory Gauges and Production Cartels
Traders closely watch weekly inventory figures released by both the American Petroleum Institute and the US Energy Information Administration. These reports provide tangible snapshots of domestic supply balances. An unexpected draw in commercial stockpiles signals robust consumer appetite, frequently triggering price gains, whereas build-ups in inventories suggest excess supply and place downward pressure on spot quotes. The API issues its private assessment on Tuesday afternoons, followed by the EIA's official government data on Wednesday. Historical data shows their figures align within 1% of each other roughly 75% of the time, with the EIA metrics generally viewed as the more authoritative benchmark.
Global crude availability is also heavily swayed by the Organization of the Petroleum Exporting Countries. Comprising 12 oil-producing member nations, OPEC convenes biannual summits to establish collective production quotas. Lowering output limits tightens international availability, creating upward price momentum, while raising quotas has the opposite effect. The broader OPEC+ alliance incorporates ten additional non-member nations, most prominently Russia, providing an expanded coordination mechanism to manage global energy supply.
Spillover Across Foreign Exchange, Gold, and Digital Assets
The inflationary threat posed by climbing energy prices rippled across foreign exchange and broader financial markets. The Australian Dollar traded on the back foot below 0.7150 against the greenback on Tuesday, remaining depressed near a three-week trough reached in the prior session. Robust US Treasury bond yields holding near multi-year highs ahead of the upcoming Federal Open Market Committee meeting, coupled with rising energy-driven inflation expectations, provided solid support to the dollar while dampening demand for the Aussie. Mixed economic activity figures out of China for August also did little to revive buying enthusiasm.
At the same time, USD/JPY advanced toward the 155.00 mark during early Tuesday trading. Currency desks remained focused on policy deliberations from both the US Federal Reserve and the Bank of Japan scheduled for later in the week. While expectations of sticky US interest rates bolstered the dollar, expectations of potential hawkish normalization steps by the Bank of Japan continued to provide underlying support for the Japanese Yen, potentially tempering extended gains in the currency pair. In precious metals, Gold reclaimed the $4,300 handle as investors navigated broader Middle Eastern risks ahead of the Fed's two-day monetary policy gathering, recovering modestly from its six-week low near $4,250. Within digital asset markets, Bitcoin traded steadily around $78,000, defending a 2% bounce from Monday amid broader crypto volatility prior to the anticipated CLARITY Act cloture vote, with Zcash and Stellar outperforming the broader market over the prior 24 hours.