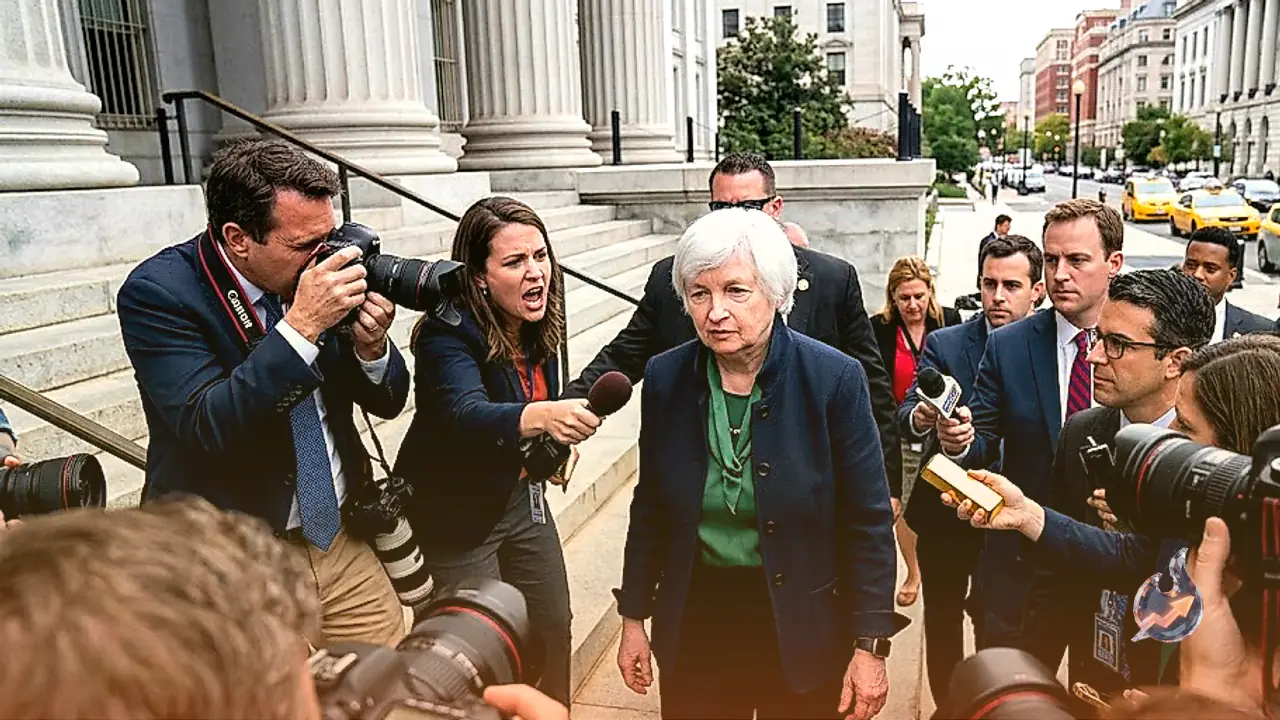

























A sharp rebound in long-term US Treasury yields has reignited upward pressure on the US Dollar, driving foreign exchange rates back to levels seen prior to major central bank market interventions. The 10-year US Treasury yield has climbed back to 4.7 percent, while the 30-year yield has reached 5.24 percent. This resurgence in yields is creating headwinds for broader risk assets while triggering renewed strength in the US Dollar Index (DXY). Much of this dollar recovery stems from pronounced weakness in the Japanese Yen, which has allowed USD/JPY to press toward the 159.00 threshold and pushed EUR/JPY up to 185.71, virtually erasing the impact of past official market operations.
Market Interventions Fail to Maintain Lasting Impact
Financial market participants are taking note of a striking pattern across currency and debt markets over the past month. According to market analyst Michael Wan of MUFG, both major official market interventions conducted recently have seen exchange rates and yield levels revert close to their pre-intervention baselines. The first major action occurred on July 30, when monetary authorities in the United States and Japan executed a joint foreign exchange intervention designed to prop up the Japanese Yen. The second key development came on August 19, when the US Treasury Department announced an unexpected bond buyback initiative to support debt market liquidity.
Despite these high-profile policy maneuvers, foreign exchange trends have rapidly reasserted themselves. MUFG analyst Michael Wan highlighted that it is particularly notable how current market pricing has moved right back toward pre-action levels. The persistent underperformance of the Japanese Yen has served as the primary engine for the broader recovery in the Dollar Index, overcoming the short-term resistance created by official policy interventions in both Washington and Tokyo.
US Treasury Expands Debt Buyback Program
A central driver of ongoing fixed-income market activity has been the unexpected policy adjustment from the US Treasury Department. Stepping off its regular calendar schedule on Wednesday at 12:32 GMT, the department revealed plans to significantly enlarge its liquidity support buyback operations within longer-dated government debt sectors. The liquidity enhancement targets government securities in the 10-year to 20-year maturity bucket as well as the 20-year to 30-year sector.
Under the modified guidelines, the maximum operation size will at least double, expanding from $2 billion per operation to at least $4 billion. This expanded purchasing framework is scheduled to take effect on September 9 and will continue through November 4. By doubling the ceiling on these long-term bond purchases, officials aimed to bolster market liquidity across the yield curve, though subsequent market movements have seen long-end yields rise back toward recent peaks.
European Currencies Resolute Against Dollar Fluctuations
While the Japanese Yen faces sustained pressure, other major currency pairs have demonstrated relative resilience against the US Dollar during Friday trading sessions.
In the European session, GBP/USD traded in positive territory near 1.3650. The British Pound found fundamental backing from stronger-than-expected Purchasing Managers' Index (PMI) survey data released across the United Kingdom. This upbeat economic activity report helped Sterling overcome negative sentiment generated by disappointing UK Retail Sales figures. Furthermore, the US Dollar struggled to maintain upside traction following the Treasury Department's expanded bond purchase schedule, helping GBP/USD maintain a stable footing ahead of incoming US PMI statistics.
Simultaneously, EUR/USD consolidated its weekly advance around the 1.1700 region during European trade. The Euro navigated a mixed backdrop of preliminary August PMI readings coming out of Germany and the broader Eurozone. As currency traders awaited the preliminary August PMI surveys from the United States, ongoing underlying weakness in the Greenback enabled EUR/USD to preserve its prevailing gains.
Gold Holds Gains Amid Shifting Federal Reserve Rate Expectations
In commodity markets, Gold remained firm near its highest price level since early June, hovering just above $4,550 as European trading got underway. The precious metal is attempting to build on technical breakout momentum after climbing above its technically key 200-day Simple Moving Average (SMA).
Support for gold prices has been reinforced by a subdued dollar environment and shifting expectations surrounding Federal Reserve monetary policy. Market participants recently scaled back their expectations for an immediate interest rate hike by the US central bank after the latest US inflation data pointed toward moderating price pressures. With inflation signals cooling, traders are recalibrating interest rate trajectories, providing underlying support for non-yielding bullion.
Technical Analysis and Live Data for USD/JPY
Live market data shows USD/JPY trading at 158.84, reflecting a daily increase of +0.36 percent over the previous session close of 158.28. Over the past 52 weeks, the currency pair has traded within a wide corridor bounded by a low of 146.22 and a high of 163.98, displaying solid overall trend continuity.
Technical indicators present a balanced setup within a broader bullish structure. The 14-period Relative Strength Index (RSI) stands at 42, placing the pair in neutral territory. The Moving Average Convergence Divergence (MACD) indicator signals mild bullish momentum, with the MACD line at -0.69 positioned just above the signal line at -0.71, yielding a positive histogram reading of 0.02.
Moving average configurations highlight a persistent long-term uptrend. The 20-day Exponential Moving Average (EMA) sits at 159.63, the 50-day EMA is at 160.24, and the 200-day EMA stands at 157.62. The 50-day Simple Moving Average (SMA) is at 161.03 while the 200-day SMA rests at 158.30. The technical alignment exhibits a golden cross pattern with the EMA50 positioned firmly above the EMA200. Price action currently resides comfortably within the 20-period Bollinger Bands, which range from a lower band of 155.48 to an upper band of 163.91, around a midpoint of 159.69. The Average Directional Index (ADX) reads 42, reflecting a strong trending market, while Stochastic oscillators show the fast line at 68 and signal line at 71.
Key trading levels include an intraday pivot point at 158.77. Overhead resistance is identified at R1 of 159.20 and R2 of 159.56. On the downside, immediate support rests at S1 of 158.41, followed by secondary support at S2 of 157.99. Extended 20-day support aligns around 155.26, while major upper resistance remains positioned near 163.94, with the 14-day Average True Range (ATR) measuring 1.17 daily volatility for risk management.