























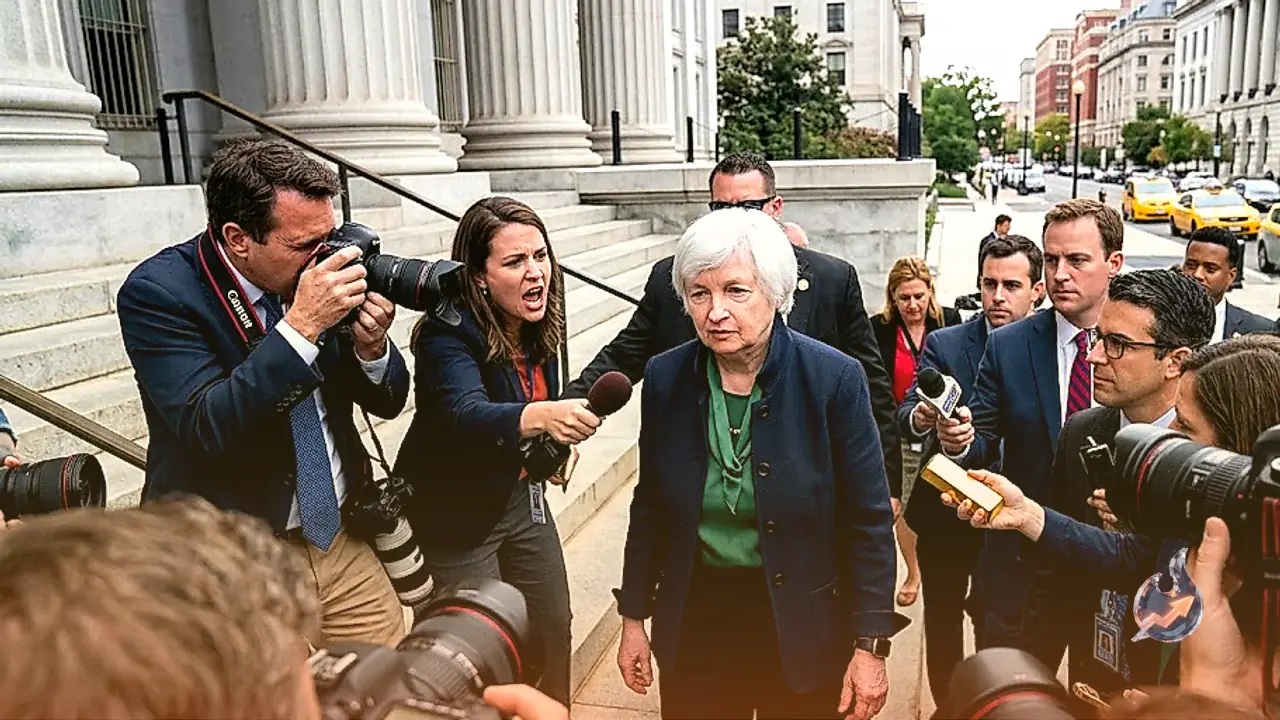

Risks of a renewed surge in US Treasury yields remain elevated as underlying macroeconomic fundamentals stay stubbornly unchanged. Financial analysts emphasize that high inflation, rising federal budget deficits, and massive investment demand tied to artificial intelligence (AI) continue to exert upward pressure on borrowing costs. While the US Congress and the White House hold the constitutional authority to address these structural drivers through fiscal policy, the US Treasury Department has instead relied on direct market intervention. This shift in strategy runs the risk of heightening market volatility, ultimately prompting investors to demand an even larger risk premium on sovereign debt.
US Treasury Liquidity Buybacks and Debt Ceiling Constraints
Departing from its regular schedule, the US Treasury Department unveiled expanded liquidity support buyback operations. Under the updated framework, the maximum size of buyback operations targeting the 10-year to 20-year and 20-year to 30-year maturity sectors will be doubled from $2 billion per operation to at least $4 billion. These enlarged operations are set to take effect on September 9 and continue through November 4. By altering debt issuance dynamics, the intervention has introduced unpredictability into fixed-income markets. Funding these operations by shifting from longer-term debt to shorter-term issuance offers only temporary relief, as total debt capacity remains strictly constrained by the statutory debt ceiling.
Foreign Exchange Impact: GBP/USD and EUR/USD Hold Gains
The Treasury's aggressive long-term bond purchase plan has left the US Dollar (USD) struggling for traction against major peers. This weakness in the greenback provided strong support for rival currencies during European trading. The GBP/USD currency pair maintained a firm stance around 1.3650, buoyed by encouraging UK Purchasing Managers' Index (PMI) numbers that offset weaker retail sales reports. Live market data shows GBP/USD trading around 1.36, up 0.31% on the session, within a 52-week range of 1.30 to 1.38.
Similarly, EUR/USD consolidated its weekly gains near the 1.1700 region despite mixed PMI data out of Germany and the broader Eurozone. Sustained pressure on the US Dollar enabled the single currency to preserve its footing ahead of preliminary US August PMI releases.
Gold Rallies Past Technical Averages as Fed Rate Expectations Cool
A softer US Dollar bolstered gold prices, keeping the metal near its highest levels since early June. Spot gold traded firmly above $4,550 heading into the European session, sustaining technical breakout momentum above its 200-day Simple Moving Average (SMA). The rally was further supported by market participants scaling back expectations for an immediate interest rate increase by the Federal Reserve (Fed), following recent inflation metrics that indicated a moderation in price growth.
Technical Outlook and Key Trading Boundaries
From a technical standpoint, momentum indicators for GBP/USD highlight an active uptrend. The 14-day Relative Strength Index (RSI) reads at 69, approaching overbought territory, while the MACD histogram remains in positive territory above its signal line. Exponential moving averages display a bullish alignment, with the 20-day EMA at 1.35 and both the 50-day and 200-day EMAs positioned at 1.34. The Bollinger Bands span between 1.33 and 1.37, delineating immediate support near 1.33 and overhead resistance around 1.37.