























Global crude oil benchmarks remain underpinned by severe physical supply disruptions and heightened geopolitical uncertainty. West Texas Intermediate (WTI) futures on NYMEX hover near $86.00, keeping close to the previous session's three-week peak of $87.38. The primary driver behind the sustained rally is the ongoing paralysis across two vital maritime transit corridors—the Strait of Hormuz and the Bab el-Mandeb Strait—which collectively channel approximately 27% of the world's daily energy supply. With maritime traffic effectively frozen, energy markets are factoring in a protracted period of supply tightness.
Diplomatic Deadlock and US Sanctions Threat
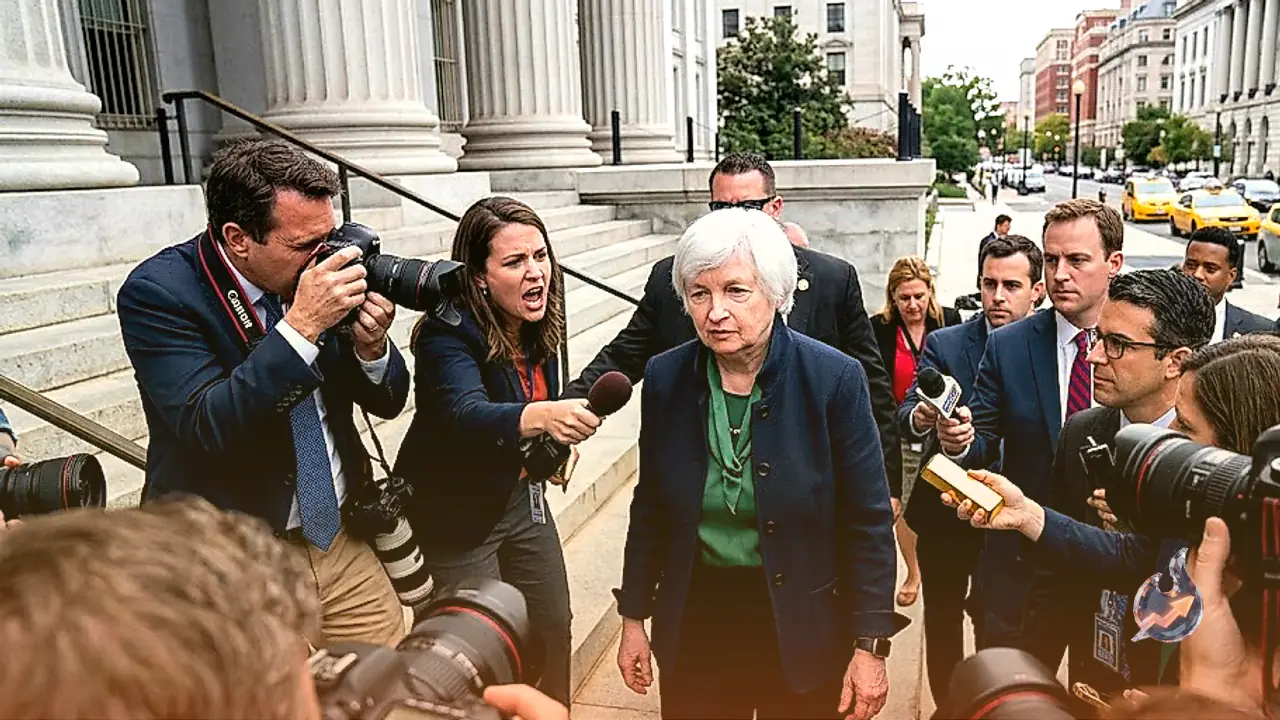
Direct negotiations between Washington and Tehran regarding the reopening of the Strait of Hormuz remain non-existent. Adding to market angst, US President Donald Trump warned of aggressive steps to isolate Iran from the international financial system, emphasizing that nations maintaining commercial or financial links with Tehran will face severe economic fallout. The tough stance dampens near-term hopes for a diplomatic breakthrough.
Analysis from Danske Bank highlights that the tone from the US administration has sharpened significantly. US Treasury Secretary Scott Bessent reaffirmed that the government intends to deploy the "toughest sanctions in history" against Tehran. However, Danske Bank notes that Secretary Bessent believes harsher economic sanctions could actually lower the probability of a broader military confrontation. Bessent suggested that energy traders may be misinterpreting official signaling by overestimating the immediate risk of armed conflict escalation.
Technical Outlook: Moving Averages Support Bullish Trend
On the daily chart, WTI Crude Oil trades at $85.74 (with recent live quotes around $86.32), maintaining a firm upward bias. The price continues to trade well above its 20-day exponential moving average (EMA) located at $82.03. Holding above this key short-term trend benchmark signals that buying pressure remains dominant in the physical and paper markets.
The Relative Strength Index (RSI-14) stands at 58.54 (and 57 in live technical feeds), holding comfortably in positive territory without crossing into overbought conditions. This indicates room for additional upside before technical momentum exhausts itself. As long as WTI preserves the $82.03 support zone, the primary pathway favors consolidation with an upside targets extending toward the two-month high of $92.25. Conversely, a daily close below $82.03 would break the constructive chart pattern and signal a deeper corrective pullback.
WTI Market Fundamentals and Global Benchmark Mechanics
West Texas Intermediate represents one of the principal pricing benchmarks for crude oil traded internationally, alongside Brent Crude and Dubai Crude. It is classified as "light" due to its low API gravity and "sweet" owing to its low sulfur content. These characteristics make WTI exceptionally high quality and inexpensive to refine into gasoline, diesel, and aviation fuel.
Extracted primarily across North American fields, WTI is delivered via the Cushing storage and pipeline terminal in Oklahoma, widely recognized as "The Pipeline Crossroads of the World." Fundamentals are governed by macro demand and physical supply balances. Global economic expansion boosts oil consumption, while economic slowdowns curtail demand. Strategic production quotas established by OPEC and the expanded OPEC+ coalition directly dictate global supply flows. Furthermore, because oil is priced globally in US Dollars, fluctuations in the USD exchange rate exert an inverse influence on oil affordability for foreign buyers.
Weekly Inventory Indicators and Macro Economic Backdrop
Traders monitor weekly stock statistics to gauge real-time supply-demand imbalances. The American Petroleum Institute (API) releases inventory estimates every Tuesday, followed by official government figures from the Energy Information Administration (EIA) on Wednesday. EIA data is considered the definitive market reference, though API statistics match within 1% approximately 75% of the time. Inventory draws signal robust demand and lift prices, whereas inventory builds indicate oversupply and weigh on futures prices.
In broader macro financial markets, the US Treasury Department recently expanded its liquidity support buyback program, doubling maximum operations in 10-to-30 year sector bonds to $4 billion. This move pushed the US Dollar lower across major currency pairs, supporting spot Gold near $4,550 while pushing GBP/USD to 1.3650 and EUR/USD around 1.1700 ahead of preliminary PMI surveys.