





















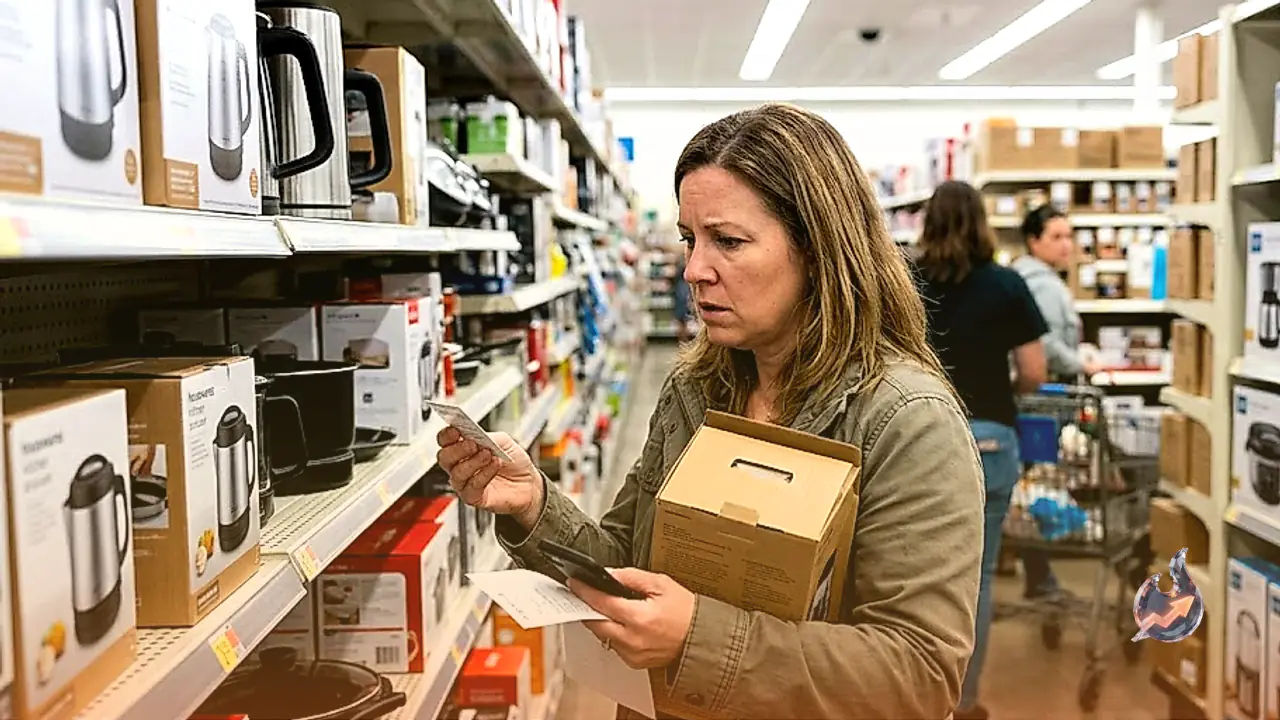

The latest inflation figures reveal two simultaneous cost shocks with starkly different lifespans. In the September Consumer Price Index release, headline inflation reached 3.7 percent, driven heavily by an energy index that surged 20.4 percent over the past twelve months. That single category accounted for roughly 1.3 percentage points of the headline number. Yet, energy costs can reverse swiftly once crude markets stabilize. Brent crude had fallen back to its pre-war level on July 1, only to spike back over $100 per barrel by month-end after an armistice collapsed on July 8. In contrast, import duties leave a far more enduring footprint. The tariff burden lands on core goods excluding food and energy, which represent about 0.1 percentage points of the index and slowed from a 1.0 percent pace in February down to 0.7 percent. Even as legal challenges interrupted tariff programs, each policy was promptly replaced with another duty, cementing a higher baseline that simply does not decline once established. When geopolitical conflicts fade, the massive energy spike will drop out of the headline metric, but the higher price tags created by trade duties will stay permanently on retail shelves.
How Price Squeezes Split Dow Jones and S&P 500 Performance
The divergent paths of these inflation shocks are clearly reflected in benchmark equity indices, most notably the Dow Jones Industrial Average. Because the Dow is a price-weighted index, companies with higher nominal share prices wield disproportionate influence. Home Depot, which relies heavily on home turnover and building demand that gets punished by war-fueled borrowing costs and fuel surcharges, carries two and a half times the index weight of Walmart, which operates directly in the consumer goods aisles absorbing import tariffs. Consequently, Dow futures trade nearly 6 percent beneath their all-time high set on August 5, while S&P 500 futures hover within 2 percent of their record. The performance gap represents the economic toll these opposing cost pressures exert on different business models.
The Legal Evolution of Import Duties to a 20 Percent Floor
The legal framework behind existing import surcharges has undergone rapid adjustments this year. The Supreme Court ruled on February 20 that the national emergency statute relied upon to impose the 2025 tariffs lacked statutory authority to establish import levies. The administration responded on February 24 by instituting an alternative 10 percent emergency surcharge under a different legal mechanism. When that interim surcharge expired on July 24, officials immediately enacted a 12.5 percent Section 301 levy targeting Chinese imports. Because an earlier 7.5 percent Section 301 duty enacted in 2019 on Chinese toys was never repealed, Chinese manufactured playthings faced a combined 37.5 percent tariff in September 2025 and currently carry a baseline 20 percent charge with no specified sunset provision.
The judiciary also addressed who ultimately funded these duties at entry points, confirming that domestic importers paid the levies and instructing the government to issue reimbursements. Treasury Secretary Scott Bessent characterized these duties in March 2025 as a one-time price adjustment. From a strictly technical standpoint regarding month-to-month inflation rates, that assessment is correct, yet for everyday shoppers, a one-time upward structural adjustment is an expense incurred on every trip to the register.
Toy Prices Surge While Real Household Pay Shrinks
Granular price tracking underscores how duties affect product lines differently. Toy prices dropped 2.3 percent in August before leaping 4.2 percent in September. Taking a smoothed annual perspective, toy inflation escalated from 2.3 percent to 6.6 percent. Boy's apparel climbed from a 3.9 percent annual rate to 7.8 percent, and computer hardware rose 9.7 percent year-over-year, contrasting with broader goods categories that generally softened. The Toy Association notes that approximately four out of every five toys sold across the United States originate from Chinese factories. Walmart noted that toy purchases drove its general merchandise sales expansion during the quarter ending in July, demonstrating that higher shelf tags coincided with continued consumer volume.
Toy manufacturer Mattel noted in February that its wholesale price adjustments would not reach full saturation until mid-2026. Therefore, September represents merely the initial wave of holiday inventory priced under earlier tariff layers, with the existing 20 percent baseline anchoring those elevated tags. Donald Trump remarked on April 30, 2025, that children might receive two dolls rather than thirty dolls, noting that each would cost a couple of bucks more. Meanwhile, the family paying 6.6 percent more per doll possesses 0.7 percent less real purchasing power than twelve months ago, eroded largely by expensive motor fuel. Tariffs established the product price while the geopolitical energy crisis constrained the household budget.
The Real Estate Stagnation Discounting Home Goods
In contrast to the toy market, home furnishings and bedding declined 0.8 percent in September, leaving them down 2.4 percent on an annual basis. Major household appliances retreated 1.0 percent while television prices dropped 1.9 percent. These items are subject to the identical 20 percent Chinese import levy, yet their consumer prices are weakening because purchasing demand requires people to relocate, and household mobility has largely stalled. Freddie Mac reported the benchmark 30-year fixed home loan rate at 7.40 percent as of October 8, a substantial jump from 6.30 percent recorded one year prior.
This financing hurdle stems from the 10-year Treasury yield climbing an entire percentage point since hostilities erupted. Treasury Secretary Scott Bessent maintains that benchmark Treasury yields will revert to their mid-February baseline once geopolitical tensions subside. In the meantime, data from the National Association of Realtors shows existing home sales running at an annualized pace of 3.99 million transactions in September, cementing August and September as the slowest housing months of the entire year.
Customs Refunds Fuel Price Wars in Grocery Aisles
Customs authorities have approved $134.7 billion in duty refund requests, providing substantial balance-sheet relief to major retail chains. Walmart captured roughly $2.9 billion in reimbursements during its quarter ending in July, Target secured $994 million, and Home Depot collected $685 million. Walmart announced that it allocated the bulk of its refund capital toward funding temporary price rollbacks on more than 11,000 retail items, focusing heavily on staple groceries and general inventory. This occurred even as the retail giant absorbed over $2 billion in incremental corporate fuel expenses across the full year. In the September CPI data, supermarket grocery prices slipped 0.1 percent on the month and registered a 1.8 percent annual rise, moderating from 2.2 percent in August. While tariff reimbursements effectively subsidized everyday grocery discounts, the persistent 20 percent levy remained fully embedded in toy departments.
Lagging Medical Metrics Create Core Inflation Distortions
Core consumer inflation, which omits fluctuating food and energy inputs, settled at an annualized 2.6 percent, aided significantly by unusual deflationary readings in private insurance lines. The official index recorded health insurance premiums falling 9 percent year-over-year, while personal vehicle coverage dropped 5 percent. Because the Bureau of Labor Statistics cannot track direct premium payments reliably, it derives health insurance price movements from retained underwriting margins reported by private carriers, utilizing accounting figures that run roughly ten months behind real-time market trends. The index portrays health coverage as 9 percent more affordable simply because insurers generated smaller operating margins last year. In contrast, researchers at health policy organization KFF found that individual policyholders on public exchanges faced an average 58 percent surge in out-of-pocket monthly premiums, pushing typical costs to $178 per month.
Furthermore, the underwriting margin compression captured by government statistics has already reversed across the healthcare industry. Dow component UnitedHealth, which holds a substantial 4.4 percent index weighting, announced on October 13 that its medical loss ratio improved to 88.4 percent from 89.9 percent a year earlier, alongside adjusted quarterly earnings of $4.69 per share against $2.92 previously. Stripping out the artificial downward drag from these delayed insurance calculations places actual core inflation closer to 2.9 percent than the reported 2.6 percent figure.
Market Technicals and Crucial Upcoming Catalyst Dates
From a chart perspective, Dow futures have carved out a sequence of declining peaks across early September, mid-September, and October 13. Simultaneously, the index rebounded twice from an identical support base established during the initial ten days of October. The daily Stochastic Relative Strength Index sits near neutral mid-range territory and was climbing off that floor when the inflation report dropped, indicating the market absorbed the release from a balanced posture rather than an overextended condition.
Turning to real-time commodity inputs, Crude Oil futures trade at $96.41, gaining 1.39 percent from the previous session close of $95.09, inside a 52-week band of $54.98 to $119.48. Trading volume stands at 0.69 times the 20-day moving average. Technical indicators show a 14-day RSI of 59 and a MACD reading of 0.59 against a 0.36 signal line, generating a positive histogram of 0.23. The 20-day exponential moving average rests at $92.99, the 50-day EMA at $90.89, and the 200-day EMA at $81.85, confirming an ongoing golden cross pattern and sustained primary uptrend. Critical trading thresholds feature a central pivot at $95.20, overhead resistance at $97.95 (R1) and $99.48 (R2), with dynamic floor support situated at $93.67 (S1) and $90.92 (S2). The 14-day Average True Range measures 4.09 points.
The near-term performance skew favors the broader market over the Dow while housing turnover remains paralyzed by elevated mortgage costs and home goods retailers reduce prices. A crucial market test arrives on November 10 with the release of October CPI metrics. Ongoing grocery deflation would indicate that customs refunds continue to offset fuel shipping expenses, while stabilizing home decor prices would signal that furniture importers are regaining pricing power. Key retail earnings from Home Depot on November 17 and Walmart on November 19 will provide concrete confirmation of inventory dynamics. While an eventual military resolution would quickly lower energy expenses and relieve home improvement chains, permanent trade tariffs guarantee that consumer goods prices will remain stubbornly high.