















Cryptocurrency markets witnessed broad-based selling pressure on Thursday as leading altcoins remained heavily capped beneath critical technical resistance levels. Driven by worsening macroeconomic conditions, structural breakdowns across daily charts, and widespread risk aversion, major digital assets including Ripple, Cardano, and Solana are struggling to find sustainable buying interest near key support zones. The ongoing downside momentum suggests that the bearish phase across the altcoin space may continue in the near term.
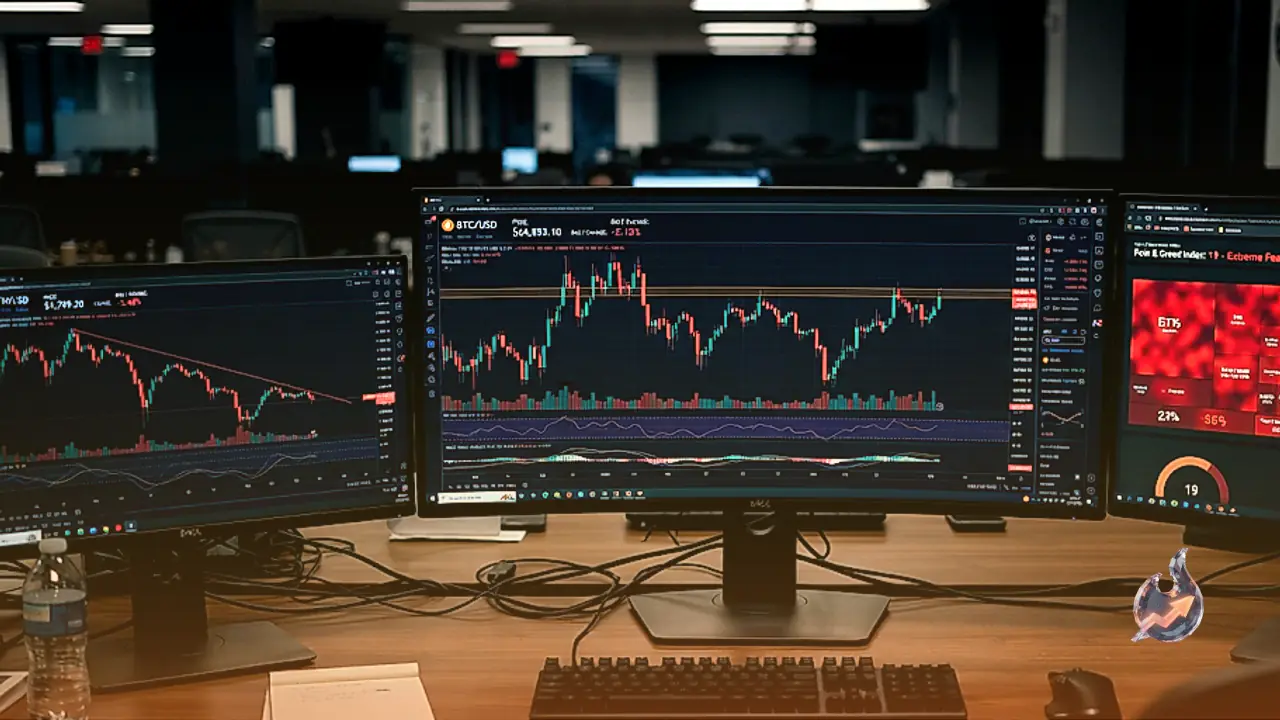
Broader market sentiment has deteriorated sharply, with the CoinMarketCap Fear and Greed Index sinking to 11 on Thursday, marking a four-month low. This reading reflects an intense risk-off environment across the digital asset ecosystem. The backdrop has been rattled by high-profile corporate developments, including the resignation of Nvidia Chief Executive Officer Jensen Huang, alongside persistent inflation concerns that continue to inject volatility into broader financial markets. Both Ripple and Stellar extended their declines on Thursday, weighed down by deteriorating derivatives metrics and cautious on-chain signals that underscore persistent downward pressure.
Ripple Capped Below Resistance With Key Support in Focus
Ripple traded in the vicinity of $0.9600 on Thursday, held firmly in check by a short-term resistance ceiling near $0.9862. Momentum indicators reflect continued vulnerability across the pair. The Moving Average Convergence Divergence line sits beneath the zero mark, confirming that bearish forces remain in control. Meanwhile, the Relative Strength Index is lingering near 30. While this metric highlights oversold conditions, it has yet to produce any clear technical divergence or decisive sign of an impending turnaround.
To the upside, initial overhead resistance stands at $0.9862, followed by a more significant technical hurdle at $1.0692. Beyond those thresholds, the 50-day exponential moving average at $1.1992 converges with descending trendline resistance around $1.2279 to form a dense supply zone. This band acts as a distant structural ceiling that buyers must overcome to alter the prevailing trend. On the downside, primary support rests at $0.8930. A sustained break beneath this level would open the door to intensified selling, even though short-term momentum indicators are already noticeably stretched.
Cardano Prolongs Multi-Week Downtrend Beneath Moving Averages
Cardano changed hands around $0.1510 on Thursday, extending a persistent downtrend that has lasted for six consecutive weeks following an additional drop of more than 2% in the previous session. ADA continues to trade well below its 50-day EMA at $0.1929 as well as its 200-day EMA at $0.2239, confirming that the long-term structural path of least resistance points downward.
Momentum indicators across ADA remain exceptionally depressed. The RSI sits at 27, deep within oversold territory, while the MACD line remains pinned in negative territory. This combination signals that selling volume persists despite the stretched nature of the move. For any potential recovery attempt, immediate resistance is positioned at the 50-day EMA near $0.1929, with a secondary, more formidable ceiling at the 200-day EMA near $0.2239. On the downside, the June 26 low of $0.1385 represents the next major structural base where buyers could potentially step in to halt further declines.
Solana Strains in Deeply Oversold Territory
Solana dropped to $73.32 on Thursday after a 2% slide in the prior session, before edging up slightly to $74.29 during the live market session, marking a 0.91% advance above its previous close of $73.62. Over the past 52 weeks, the asset has fluctuated between $60.41 and $124.62, while current trading activity shows volume at 0.80 times the 20-day average. Despite minor consolidation, the short-term technical bias remains decisively bearish.
Solana trades below both its 50-day EMA at $92.23 and its 200-day EMA at $95.08, with the 50-day crossing below the 200-day to signal an active death cross pattern. Additional moving averages show the 20-day EMA at $82.72, the 50-day SMA at $98.17, and the 200-day SMA at $88.58. The 14-day RSI stands at 30, while the MACD records a reading of -7.36 against a signal line of -6.88, leaving a negative histogram of -0.48. The 20-day Bollinger Bands span from $66.95 to $100.59 around a middle band of $83.77. With an ADX of 48 confirming a strong trend, immediate support lies at $73.15 and $72.00, ahead of the 20-day support band near $67.50 to $67.55, and a deeper floor at $60.13. On the upside, resistance is mapped at $75.25 and $76.21, ahead of $77.60, $87.46, and the prior cap at $95.82.
Pi Network and Stellar Show Fragile Price Action
Elsewhere in the market, Pi Network managed a mild relief bounce on Thursday following a 7% loss the day before. The small recovery coincided with Day 2 of the Pi Ecosystem Summit, where announcements included the launch of Pi DataLab alongside the AI-assisted SoloHost application. However, technical indicators point to the risk of an extended decline below $0.0500 as broader liquidation pressures persist.
Stellar mirrored the weakness observed in Ripple, with both assets struggling to attract steady bids. Derivatives metrics across these tokens reflect a pronounced bearish posture, characterized by declining open interest and defensive positioning among traders. Until broader macroeconomic sentiment stabilizes and major tokens can reclaim their intermediate moving averages, the digital asset sector appears vulnerable to ongoing volatility and corrective pressure.