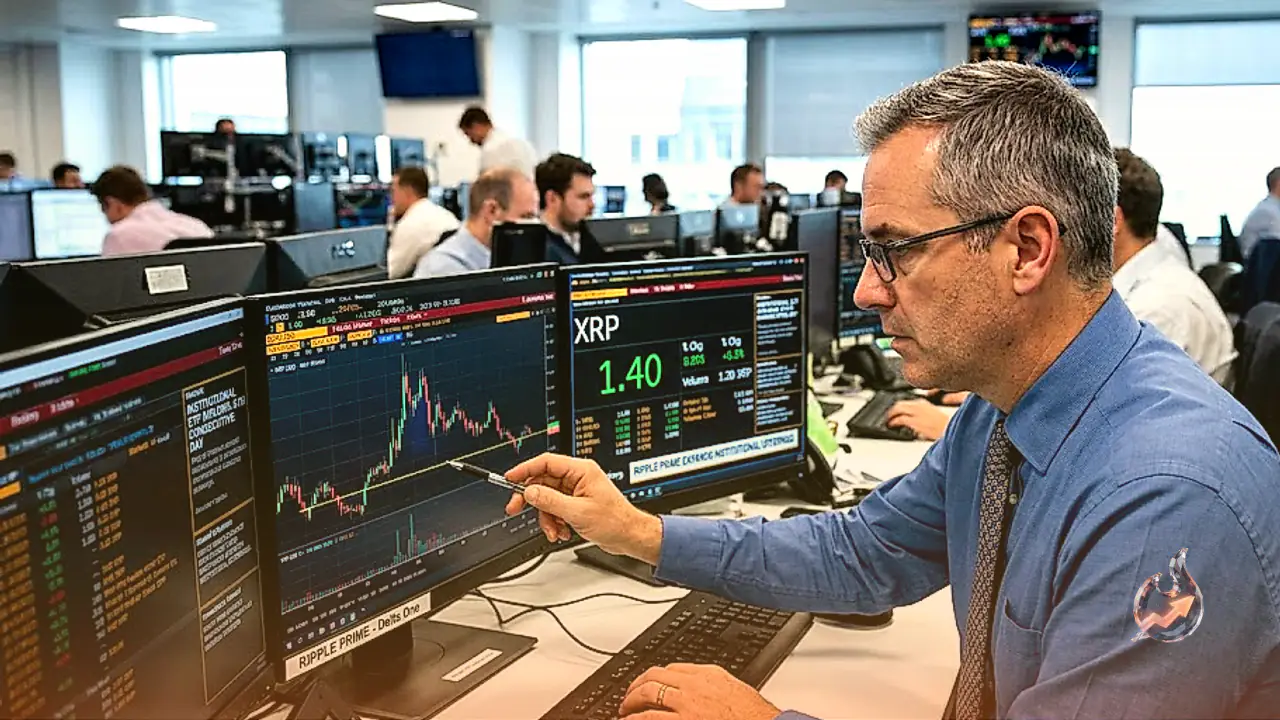

























Ripple (XRP) has initiated a steady rebound after testing critical support at $1.40, with live trading data placing the asset at $1.46 following a 2.86 percent gain from its previous close of $1.42. Buyers returned to the market after three consecutive days of price declines, though upside movement faces immediate technical hurdles. Concurrently, Stellar (XLM) continues to trade above $0.18, consolidating between major moving averages as market participants watch for a potential breakout. The broader cryptocurrency market exhibits short-term bullish momentum, underpinned by Bitcoin advancing toward the $80,000 mark following strategic macroeconomic developments in the United States.
Market dynamics across major digital assets reflect a cautious optimistic sentiment. While Bitcoin leads the sector higher following news that the US Treasury is doubling its debt buyback operations, individual token structures present distinct technical setups. XRP, XLM, and major altcoins like Ethereum are benefiting from increased market liquidity, whereas assets such as Cardano face localized pullbacks after significant multi-day rallies.
XRP Technical Structure and Key Price Thresholds
The technical structure for XRP remains constructively bullish in the near term as the price trades above several key Exponential Moving Averages (EMAs). XRP currently holds positions above its 50-day EMA at $1.17, 100-day EMA at $1.20, and 200-day EMA near $1.35 (with live 200-day EMA data recorded at $1.39). Additional moving average benchmarks include the live 20-day EMA at $1.26, the 50-day Simple Moving Average (SMA) at $1.13, and the 200-day SMA at $1.28. This alignment confirms a established long-term uptrend despite recent short-term pullbacks.
Momentum indicators present an elevated yet stretched profile. The Relative Strength Index (RSI) hovers in the low-70s, with live data measuring RSI at 74, indicating overbought market conditions. Meanwhile, the Moving Average Convergence Divergence (MACD) remains positive, with a line value of 0.11 against its signal line of 0.07 and a positive histogram reading of 0.04. This configuration indicates that buyers maintain operational control, although stretched conditions suggest the possibility of near-term turbulence or consolidation before higher levels can be sustained.
Price chart geography highlights clear structural levels for traders monitoring upside extensions or downside protection. Immediate resistance sits around the current breakout region and psychological threshold of $1.50, with live resistance levels calculated at R1 of $1.49 and R2 of $1.51, alongside a 20-day upper resistance around $1.68. A decisive breakout above the $1.50 zone would open the pathway toward $1.70. Conversely, immediate structural support sits at the $1.43 breakout level and live S1 support of $1.42. Secondary demand rests at the 200-day EMA near $1.35 (live S2 at $1.37), while deeper structural support is anchored by the 100-day EMA at $1.20 and 50-day EMA at $1.17. Live Bollinger Bands span from $0.7621 to $1.61 with a midpoint of $1.19, while the Average Directional Index (ADX) stands at 45, reflecting strong trend strength alongside an Average True Range (ATR) daily volatility buffer of 0.08.
Derivatives Market Metrics and Open Interest Dynamics
Derivatives data provides crucial context regarding market participation and capital commitment. Derivatives metrics reveal that XRP futures Open Interest (OI) registered a minor decrease to 2.44 billion XRP on Thursday, compared to 2.38 billion XRP reported on the preceding day. While this figure remains below the monthly peak of 2.78 billion XRP, it continues to hold higher than the 2.12 billion XRP recorded on August 12. Retail trading participation has remained stable, though it currently lacks the aggressive volume necessary to propel a sustained breakout beyond major resistance barriers.
Understanding the mechanics of derivatives indicators is essential for interpreting current market behavior. High and rising Open Interest is typically associated with robust market liquidity and fresh capital inflows, signaling increased market efficiency and the continuation of an ongoing price trend. Conversely, declining Open Interest indicates position liquidation, capital exit, and diminishing asset demand, which often fosters bearish sentiment among investors.
Funding rates also play a vital role in balancing spot and futures contract prices. A consistently high and positive funding rate reflects bullish sentiment, as long position holders pay short position holders while anticipating higher future prices, though this elevates liquidation risks during sudden market dips. In contrast, a negative funding rate signals prevailing bearish sentiment, indicating that traders anticipate further price declines and a potential trend reversal.
Stellar (XLM) Consolidates Between Moving Averages
Stellar (XLM) is currently trading above $0.18, maintaining a neutral-to-bullish near-term bias following a rebound from the mid-$0.15s. The asset continues to hold comfortably above its 50-day and 100-day EMAs. However, upside progression remains constrained directly beneath the 200-day EMA located at approximately $0.19. This creates a tight consolidation corridor where buyers and sellers are competing for directional control.
Technical indicators for XLM confirm improving momentum without confirming a fully decisive breakout. The RSI sits at approximately 56, reflecting balanced buying pressure. The MACD histogram remains above zero with positive values, though the momentum is moderating. Immediate topside resistance is defined by the 200-day EMA at $0.19, with a stronger horizontal supply zone situated at $0.22 that caps broader bullish attempts unless broken with convincing volume.
On the downside, initial technical support for XLM is located at the 100-day EMA near $0.18, which coincides directly with the 50-day EMA. As long as price action stays above this moving average cluster, market pullbacks are expected to attract buyer interest, keeping the overall technical structure mildly constructive while the asset consolidates under the $0.19 resistance zone.
Broader Crypto Market Performance: Bitcoin, Ethereum, and Cardano
The movement in Ripple and Stellar unfolds against a backdrop of broader strength across the cryptocurrency sector, spearheaded by Bitcoin. Bitcoin has extended its rally toward $80,000, trading above $77,000 on Friday after climbing more than 20 percent to reach its highest price level since mid-May. Market sentiment received a significant boost after the US Treasury announced it would double its debt buyback operations, an event that triggered the 7th-largest liquidation event in cryptocurrency history.
On-chain analytics for Bitcoin show that the Spent Output Profit Ratio (SOPR) indicator is holding above 1. This reading signals mild profit-taking among holders, yet the steady absorption of supply by active buyers suggests ongoing price stability and growth potential. Meanwhile, Ethereum mirrors Bitcoin's positive structure, trading above $2,500.
In contrast to the broader market advance, Cardano (ADA) is trading in the red on Thursday, logging weekly losses of approximately 10 percent. This pullback follows a sharp 30 percent rally during the previous week, pointing toward market capitulation as retail demand in ADA futures wanes alongside falling Open Interest and reduced funding rates. Financial analyst John Isige highlights that monitoring these technical and derivatives indicators provides actionable insights into how liquidity and trader sentiment shape emerging crypto market trends.