























Gold (XAU/USD) entered a healthy technical consolidation phase after touching its highest level since mid-May near the key $4,700 per troy ounce barrier, pausing a powerful three-week rally that had generated gains of nearly 14%. The temporary pullback in the precious metal was primarily triggered by a confluence of hawkish Federal Reserve interest rate projections, persistent US consumer inflation readings, and a subsequent rebound in the US Dollar index. According to live market data, Gold is currently trading around $4,626 per ounce, reflecting a modest daily gain of +0.36% relative to its prior closing level of $4,610. Over the past 52-week trading window, Gold has traversed between a low of $3,400 and a high of $5,586. Technical indicators suggest that this recent price decline represents a temporary profit-taking correction rather than a structural bearish trend reversal, leaving the broader primary uptrend firmly intact.
Geopolitical Developments in the Middle East and US Economic Sanctions
Gold initiated the trading week on a firm note, advancing by approximately 1% on Monday as market participants reacted to new US economic measures targeting Iran. The US Department of the Treasury announced an expanded sanctions package designating 60 individuals, commercial entities, and shipping vessels aimed at escalating economic pressure on Tehran. However, because the Treasury stopped short of implementing severe secondary sanctions or sweeping restrictions that could disrupt international trade channels, geopolitical risk premiums subsided slightly, providing initial tailwinds for bullion prices.
US Treasury Secretary Scott Bessent issued an explicit warning to global commercial partners, indicating that nations failing to sever business relations with Iran risk being severed from the US Dollar-denominated global banking system. However, Secretary Bessent declined to specify which foreign countries might be targeted or what specific financial penalties would be enforced. This strategic ambiguity left market participants cautious regarding potential secondary effects on global supply chains and cross-border payment networks.
Concurrently, diplomatic reports indicated that Iran and Oman reached a preliminary agreement to establish a temporary commercial shipping corridor through the strategic Strait of Hormuz. Despite this development, Iranian officials maintained a firm stance, emphasizing that the waterway would not be fully restored for unrestricted maritime traffic until the United States lifts its naval blockade and reinstates its commitments under the formal Memorandum of Understanding (MoU). Meanwhile, international mediators from Qatar and Pakistan are actively continuing diplomatic efforts to encourage Washington and Tehran to pursue a negotiated settlement. Commodity analysts note that if direct diplomatic negotiations succeed in lowering global crude oil prices, reduced energy costs could bolster Gold's bullish momentum by curbing broader market volatility.
PCE Inflation Trends and Hawkish Commentary from Fed Officials
On Tuesday, Gold momentum brought price action within touching distance of the psychological $4,700 mark before upward traction faltered. The stabilization of the US Dollar ahead of major economic data releases capped XAU/USD upside potential. On Wednesday, the US Bureau of Economic Analysis (BEA) published its July Personal Consumption Expenditures (PCE) Price Index report—the Federal Reserve's preferred measure for tracking consumer price inflation.
The official figures showed that the headline PCE Price Index rose by 3.7% year-over-year in July, while the core PCE Price Index (excluding volatile food and energy components) increased by 3.3% on an annual basis. Both readings matched the inflation rates recorded in June, indicating a stubborn plateau in disinflationary progress across the US economy. The lack of downward movement in PCE inflation provided support to the US Dollar against major currency peers midweek, precipitating a daily decline of over 1% in spot Gold prices.
Additional macroeconomic data released on Wednesday reinforced the perception of US economic resilience. Orders for US Durable Goods surged by 1.1% in July, significantly exceeding consensus forecasts of 0.7%, while Personal Income expanded by 0.4%. These robust metrics diminished market expectations for aggressive interest rate cuts by the Federal Reserve in the near term.
The hawkish narrative was reinforced on Thursday by Cleveland Fed President Beth Hammack, who had dissented in favor of an interest rate hike at the prior Fed meeting. In a speech scoring an 8/10 on the FXS Speechtracker scale, Hammack stated that while the most recent inflation numbers met expectations, the persistence of price pressures means "now is time to act." She argued that current monetary policy is not sufficiently restrictive and suggested that the neutral interest rate resides on the higher side. Hammack expressed repeated concerns regarding the potential emergence of an "inflationary mindset," public confidence in the Fed's 2% target, and cost-of-living challenges. Her comments signaled a readiness to endorse further rate increases or resist rate cuts, a policy configuration that typically supports the US Dollar while weighing on non-yielding assets like Gold.
Jackson Hole Symposium and Nuanced Labor Market Indicators
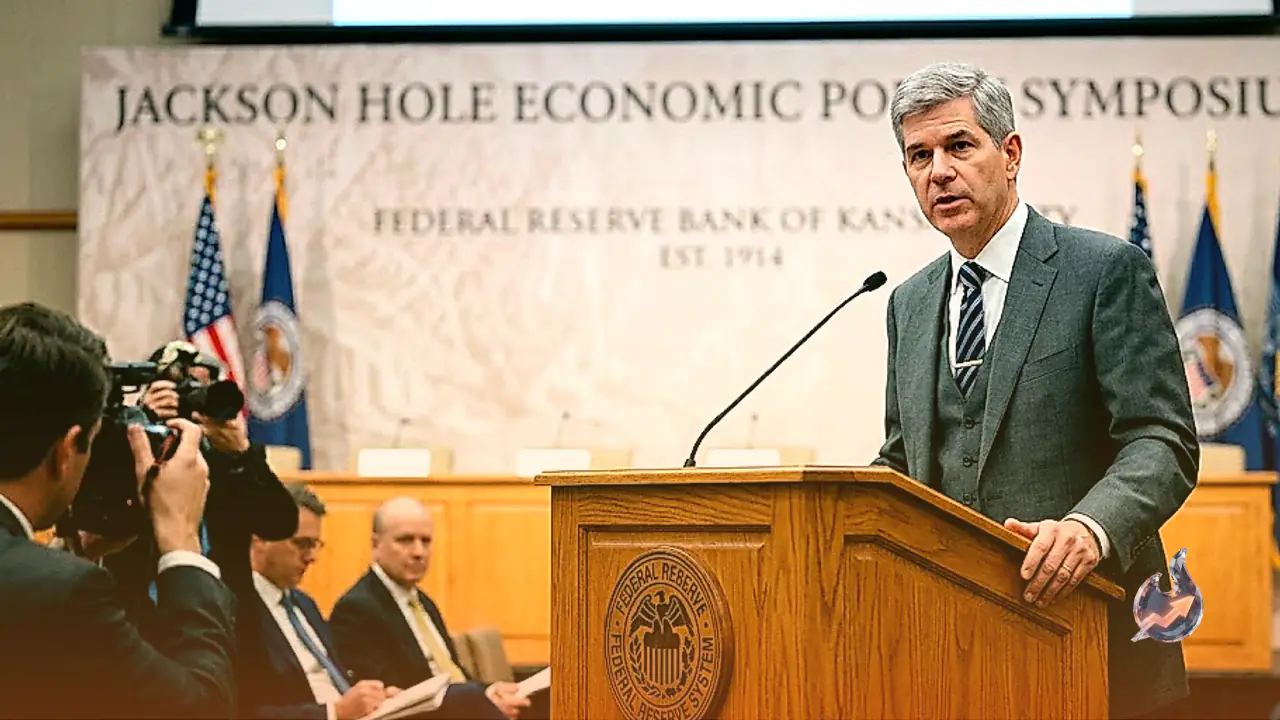
Financial markets focused on the Jackson Hole Symposium on Friday, where Fed Chair Kevin Warsh delivered a distinctly hawkish-leaning address. Warsh received an FXS Speechtracker score of 7.4/10 (compared to the 6.5 historical baseline), reflecting a heightened focus on the central bank's inflation mandate. Warsh emphasized that the Federal Reserve must remain confident underlying inflation is steadily moving toward its target, warning that "we have work to do" if progress stalls. He stated that it is "hard-pressed" to characterize current financial conditions as restrictive and noted that recent disinflation has not "meaningfully changed" underlying economic trends, signaling opposition to rapid policy easing despite solid consumer spending and business investment.
Concurrently, the US Bureau of Labor Statistics (BLS) released the July Nonfarm Payrolls (NFP) report, which showed an unexpected contraction of 23,000 jobs compared to market expectations of an 80,000 gain, accompanied by a preliminary annual benchmark revision of -79,000 jobs. However, detailed examination of the employment data revealed that labor market conditions were less dire than the headline figure implied. The majority of job losses were concentrated in government roles—particularly in education due to seasonal academic contract transitions—and the leisure and hospitality sector following the conclusion of the FIFA World Cup.
As a result, investors recalibrated their expectations regarding monetary policy. According to live data from the CME FedWatch Tool, derivative markets continue to price in an 80% probability that the Federal Reserve will raise its policy rate by at least 25 basis points (bps) by the end of 2026, creating an environment that continues to restrain Gold's upward trajectory.
Technical Perspective: Key Resistance and Support Coordinates
Technical chart analysis indicates that Gold’s retreat from $4,700 represents a corrective consolidation within a broader structural bull trend rather than a fundamental trend reversal. Live technical indicators show the 14-period Relative Strength Index (RSI) standing at 71, retreating from overbought conditions above 70 while holding comfortably above 60. This configuration confirms that bullish momentum remains intact.
The Moving Average Convergence Divergence (MACD) indicator continues to signal bullish strength, with the MACD line positioned at 124.19 above its signal line of 105.64, generating a positive histogram reading of +18.55. Furthermore, XAU/USD trades above its 200-day Simple Moving Average (SMA) located at $4,514 and its 200-day Exponential Moving Average (EMA) at $4,349. Although a death cross condition exists between the 50-day EMA ($4,342) and the 200-day EMA ($4,349), spot prices remain positioned comfortably above both moving average baselines.
To the upside, initial technical resistance is anchored between $4,675 and $4,700, marking the 50% Fibonacci retracement level of the March to August downtrend alongside a psychological round figure. A decisive breakout above $4,700 would shift focus toward the 61.8% Fibonacci retracement level at $4,850, followed by the psychological $5,000 barrier.
Conversely, if downward pressure persists, initial support aligns at S1 $4,575 and S2 $4,524, closely overlapping the 200-day SMA ($4,514). Secondary support rests near the 20-day level of $4,027. The lower and upper boundaries of the 20-period Bollinger Bands are positioned at $4,073 and $4,765, respectively, with the middle band at $4,419. The 14-day Average True Range (ATR) stands at 71.63, providing market participants with a reference for daily volatility and stop-loss placement.
Macroeconomic Fundamentals of Gold and Central Bank Reserves
Gold maintains a foundational role in global finance as a store of value and medium of exchange. Beyond its industrial applications and use in fine jewelry, bullion functions as a premier safe-haven asset during periods of financial market volatility and geopolitical instability. Because Gold carries no credit risk and is independent of sovereign issuers, it serves as a natural hedge against inflation and fiat currency devaluation.
Central banks represent the largest institutional buyers of Gold. To support national currencies during periods of uncertainty and bolster economic confidence, central banks actively diversify their foreign exchange reserves into physical gold. Data from the World Gold Council shows that central banks accumulated 1,136 tonnes of Gold valued at approximately $70 billion in 2022—the highest annual purchase volume since record-keeping began. Central banks in emerging economies, including China, India, and Turkey, continue to expand their official gold reserves at a rapid pace.
Gold exhibits an inverse correlation with the US Dollar and US Treasury yields. When the US Dollar depreciates or Treasury yields decline, Gold typically experiences increased investment demand. Furthermore, Gold maintains an inverse relationship with risk assets such as equities; stock market rallies tend to temper bullion demand, whereas equity sell-offs drive capital allocation toward Gold.
Cross-Asset Dynamics Across Forex, Commodities, and Crypto
The stabilization of the US Dollar and rising Treasury yields exerted spillover effects across global asset classes. In foreign exchange, GBP/USD receded toward the 1.3530 zone under dollar buying pressure, while EUR/USD dropped to seven-day lows below the 1.1600 level.
Cryptocurrency markets mirrored the profit-taking environment seen in precious metals. Bitcoin (BTC) slipped back below $80,000 after failing to breach resistance in the $81,000 to $82,000 range. Ethereum (ETH) declined toward $2,500, while Ripple (XRP) moved toward support at $1.40.
In commodity markets, the US diesel crack spread—the price differential between ultra-low sulphur diesel futures and WTI crude oil—surged above $100 per barrel for the first time in history, attaining an intraday record high of $102.00. This milestone highlights structural supply tight spots within refined fuel markets as investors monitor macroeconomic policy decisions.
Market Outlook and Key Factors to Watch Next Week
Looking ahead to the upcoming trading week, market participants will maintain a keen focus on US employment data and central bank speeches to gauge the future trajectory of monetary policy. August labor market statistics will provide essential clarity on whether the economic deceleration seen in July was an anomaly or the beginning of a broader trend. Additionally, any fresh developments surrounding shipping channels in the Strait of Hormuz or US diplomatic engagements with Middle Eastern partners could rapidly alter risk sentiment.
For precious metals traders, the technical posture remains constructively aligned with long-term buyers, provided Gold defends its primary support zone around $4,524 to $4,575. A sustained weekly hold above the 200-day Simple Moving Average ($4,514) would preserve the foundation required for bulls to launch a fresh attempt at conquering the $4,700 ceiling and extending the rally toward long-term targets at $4,850 and $5,000. Conversely, a breakdown below key support levels could trigger a deeper corrective move toward the $4,400 region, aligning with the 20-period Bollinger mid-band and offering institutional investors discounted entry points.
In summary, while near-term headwinds from a firm US Dollar and hawkish Federal Reserve commentary have created a pause in Gold's upward velocity, the fundamental drivers supporting precious metals—including central bank reserve diversification, inflation hedging needs, and geopolitical uncertainties—remain structurally sound. Investors and traders will continue to balance short-term policy risks against long-term portfolio diversification strategies as global markets navigate an evolving macroeconomic landscape. As institutional investors rebalance their exposure ahead of upcoming central bank decisions, physical demand from central banks and retail buyers in key Asian markets is expected to provide an underlying floor for prices. These structural drivers ensure that gold continues to serve as an indispensable portfolio asset for managing downside macroeconomic risk across volatile market cycles.