























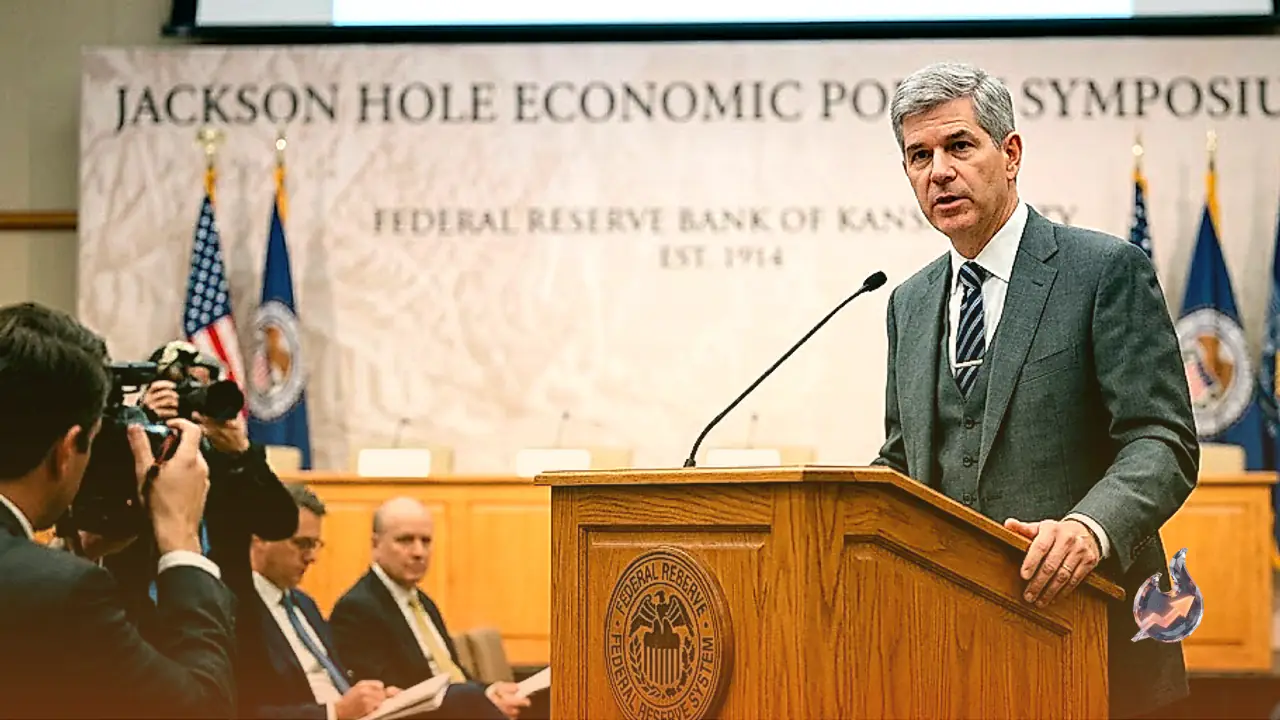

Gold markets experienced notable downward pressure after falling below the critical $4,600 per troy ounce threshold following hawkish policy remarks delivered by Federal Reserve official Warsh at the Jackson Hole Symposium. The sudden retreat in the precious metal was primarily triggered by a broad-based rally in the US Dollar and a sharp uptick in Treasury yields. As market participants recalibrate their expectations surrounding the future trajectory of interest rates, the US Dollar Index (DXY), which gauges the Greenback against a basket of six major foreign currencies, advanced by over 0.38% to reach 99.49. Simultaneously, the benchmark US 10-year Treasury yield surged by 1.5 basis points to stand at 4.686%. This shifting macroeconomic landscape reflects renewed bets on tighter monetary policy, with investors pricing in higher odds of rate hikes by the Federal Reserve later in the year.
Monetary Policy Dynamics and Federal Reserve Stance at Jackson Hole
Speaking at the annual Jackson Hole gathering, Warsh emphasized that combating inflation remains the central bank’s top priority. In his detailed remarks, Warsh noted that underlying metrics measuring core inflation have failed to demonstrate convincing improvement, signaling that monetary authorities cannot afford to relax their stance. He stressed that the central bank must achieve firm confidence that inflation is steadily returning to its official 2% target, warning that failing this objective means monetary policymakers still have significant work to execute. While acknowledging that consumer spending remains remarkably healthy and that the overall labor market exhibits solid resilience, Warsh pointed out that price stability indicators present far more concerning trends. These observations strongly imply that monetary policy will remain focused on reining in lingering price pressures.
The hawkish messaging from Jackson Hole has significantly altered market expectations regarding upcoming monetary policy decisions. Although short-term risks for immediate tightening in September have eased slightly, traders have ramped up their bets for further rate hikes by the December FOMC meeting. The prospect of higher interest rates for a prolonged period poses a direct challenge to non-yielding assets such as gold, as higher yields increase the opportunity cost of holding physical bullion relative to yield-bearing fixed-income securities.
Foreign Exchange Realignments and Broader Financial Markets
The surge in the US Dollar and Treasury yields created widespread ripples across global foreign exchange and financial asset classes. Major currency pairs retreated sharply as the Greenback regained momentum. The GBP/USD currency pair added to its weekly correction, falling toward the 1.3530 area under intensifying selling pressure. Cable’s weakness was further exacerbated by the publication of the US Non-Farm Payrolls (NFP) Annual Revision, which showed a downward adjustment of -79K jobs, compounding the market impact of Warsh’s speech.
Similarly, the EUR/USD currency pair accelerated its downward trajectory, sinking to a seven-day low in the sub-1.1600 zone by the end of the trading week. European currency markets struggled to absorb the combination of a hawkish US monetary policy narrative and softer labor benchmark revisions in the United States. Across other major central banks, market focus is shifting to upcoming policy meetings. The Reserve Bank of New Zealand (RBNZ) is widely anticipated to implement an interest rate increase, with market participants eagerly awaiting forward guidance on future rate paths. Meanwhile, the Bank of Canada (BoC) is expected to maintain its policy rate on hold, leaving investors to debate whether Canadian monetary policy might eventually tighten further in 2027.
The foreign exchange market is also bracing for key macroeconomic data releases, including the upcoming Institute for Supply Management (ISM) Manufacturing PMI and official Non-Farm Payrolls reports, which could dictate the next leg of US Dollar momentum.
Technical Breakdown and Key Price Levels for Gold (XAU/USD)
From a technical analysis perspective, gold’s price action revealed significant volatility around crucial moving averages. During the initial drop, gold price action almost tested its 200-day Simple Moving Average (SMA) located near $4,527 per troy ounce. However, prices managed a partial rebound following Warsh’s full address, lifting bullion back above the psychological $4,550 support zone. Live market trading shows gold stabilizing near $4,609 per troy ounce, reflecting a minor daily change of -0.03% within a 52-week trading range spanning from $3,400 to $5,586. Trading activity has seen exceptional volume, expanding to 17.90 times its 20-day average.
Momentum indicators suggest that while buyers retain broader structural control, short-term selling pressure is steadily increasing. The 14-period Relative Strength Index (RSI) stands at 70, placing the asset in overbought territory while sloping downward, indicating that sellers are actively stepping in on intraday rallies. Technical moving averages display a nuanced picture: while the 20-day Exponential Moving Average (EMA) sits at $4,445, the 50-day EMA stands at $4,341, the 200-day EMA at $4,349, the 50-day SMA at $4,211, and the 200-day SMA at $4,514. A technical death cross between the 50-day and 200-day EMAs remains present, even as the long-term price trend remains upward.
Bollinger Bands (20, 2) outline an envelope between $4,074 and $4,762 with a middle band at $4,418, keeping current price action well contained within normal volatility channels. The Average Directional Index (ADX) reads 31, confirming the presence of a established trend, while the Stochastic indicator reflects a fast line at 79 and a signal line at 81. Daily volatility, measured by the 14-day Average True Range (ATR), stands at 71.63 points, offering a clear measure for volatility-adjusted stop-loss buffers.
Key technical support and resistance levels define the short-term landscape for traders. On the downside, if XAU/USD decisive breaks below the 200-day SMA, it would clear a pathway toward the major psychological support at $4,500. Below that level, the 100-day SMA at $4,374 represents the next significant structural support zone. Live pivot points place primary support S1 at $4,563 and secondary support S2 at $4,518, with 20-day support established near $4,027. Conversely, for bullish traders seeking recovery, the immediate upside hurdle is situated at $4,600. A clean breakout above $4,600 could pave the way for a challenge of the August 27 daily high at $4,643, followed by pivot resistance R1 at $4,671, 20-day resistance near $4,688, and ultimate resistance R2 at $4,733 ahead of the major $4,700 target.
Strategic Importance of Gold and Central Bank Reserve Accumulation
Throughout human history, gold has served as an enduring store of value and an universally recognized medium of exchange. In modern financial systems, beyond its traditional industrial uses and aesthetic demand in jewelry, the precious metal is prized as a premier safe-haven asset. Investors consistently seek refuge in bullion during periods of geopolitical instability, macroeconomic turbulence, and financial market stress. Because gold is not tied to any single government or sovereign issuer, it functions as a reliable hedge against rampant inflation and paper currency devaluation.
Central banks around the globe represent the largest institutional holders of gold. In their effort to defend national currencies and reinforce sovereign creditworthiness during economic shocks, central banks systematically diversify their foreign exchange reserves by acquiring physical gold. Robust gold reserves enhance international trust in a nation's overall solvency and financial stability. According to authoritative data published by the World Gold Council, official monetary institutions added a record-breaking 1,136 tonnes of gold to their reserves in 2022, valued at approximately $70 billion. This represented the highest annual central bank net purchase since modern record-keeping began. Emerging market central banks, particularly those of China, India, and Turkey, have been at the forefront of this aggressive accumulation strategy.
Gold maintains a structural inverse correlation with the US Dollar and US Treasury securities, both of which also serve as primary reserve assets and safe-haven destinations. When the US Dollar weakens, gold typically appreciates, allowing global institutional investors to balance their portfolios. Furthermore, gold exhibits an inverse relationship with risk-on equities. Strong rallies in stock markets generally damp enthusiasm for gold, whereas sharp sell-offs in risky equity markets channel capital flows back into the precious metal. Because gold generates no direct yield, lower prevailing interest rates reduce the opportunity cost of holding bullion, whereas elevated borrowing costs tend to restrict upside price movement.
Divergence in Cryptocurrencies and Energy Market Volatility
The tightening financial conditions and surging US Dollar also reverberated across digital assets and energy commodities. Cryptocurrency markets witnessed noticeable pullbacks, with Bitcoin sliding back below the key $80,000 mark following an unsuccessful second attempt to breach major resistance situated between $81,000 and $82,000. Altcoins mirrored Bitcoin's cooling sentiment, as Ethereum (ETH) dropped to $2,500 and Ripple (XRP) retreated toward critical support at $1.40.
In energy markets, while headline crude oil prices appeared relatively tranquil, refined products revealed extreme underlying tightness. The US diesel crack spread, which measures the market premium of ultra-low sulphur diesel futures over WTI crude oil, surged past $100 per barrel for the first time in history, hitting an unprecedented intraday record of just over $102.00. This dramatic spike highlights severe refinery constraints and structural supply pressures in distillate fuels, demonstrating that broader commodity markets remain highly sensitive to shifting global supply-demand dynamics.