
























Severe shipping constraints through the Strait of Hormuz alongside an extended force majeure on Qatari liquefied natural gas exports are placing key global energy trade routes under intense strain. According to market observations from BNY analyst Geoff Yu, the prolonged absence of major Qatari gas flows threatens to destabilize European energy balances ahead of the winter heating season and could re-ignite inflation across global industrial channels. At the same time, crude oil benchmarks Brent and WTI, together with European natural gas benchmark Dutch TTF, reflect a highly fragile equilibrium, leaving market participants exposed to any further escalation in Middle Eastern geopolitical friction.
Qatari LNG Force Majeure and European Gas Market Exposure
The decision by Qatar to prolong its force majeure on LNG shipments affects major buyers across both Europe and Asia, effectively keeping a substantial portion of global natural gas capacity offline. The Strait of Hormuz remains a critical bottleneck, where heavily restricted vessel traffic continues to choke off supply lines. For European economies, the primary risk centres on a prolonged tightening of natural gas availability just as seasonal demand begins to rise ahead of winter. Spot LNG prices are already hovering near double their pre-war baseline levels, narrowing the margin of safety for European utilities and industrial consumers.
If shipping disruptions along the Hormuz corridor persist, European buyers will be forced to compete aggressively against Asian importers for alternative uncommitted cargoes. This heightened competition is expected to drive up import costs across the board, transmitting price pressures directly into broader consumer price indices through elevated electricity tariffs, heating bills, and industrial manufacturing costs. Consequently, Europe remains acutely vulnerable to any prolonged delay in reopening the Strait of Hormuz and normalizing Qatari LNG deliveries.
Geopolitical Bargaining and Iran's Conditions on Hormuz Shipping
Geopolitical developments surrounding the shipping lane remain closely tied to broader diplomatic negotiations. Iranian officials have indicated that restoring unrestricted transit through the Strait of Hormuz could be incorporated into a wider diplomatic agreement, provided that unspecified conditions required from the United States are satisfied. This stance reinforces the central role of the Hormuz maritime pass in any potential de-escalation framework between regional and international powers.
Market analysts note that as long as transit conditions through Hormuz remain uncertain, energy traders will continue to price in an elevated risk premium across crude oil and gas futures. While spot prices for Brent and WTI crude appear relatively steady on the surface, underlying market structures suggest that energy markets are operating under a temporary and precarious balance that could easily break if physical flows are further disrupted.
Macro Economic Shocks: Hawkish Fed Signals, Forex Pressure, and Gold Drop
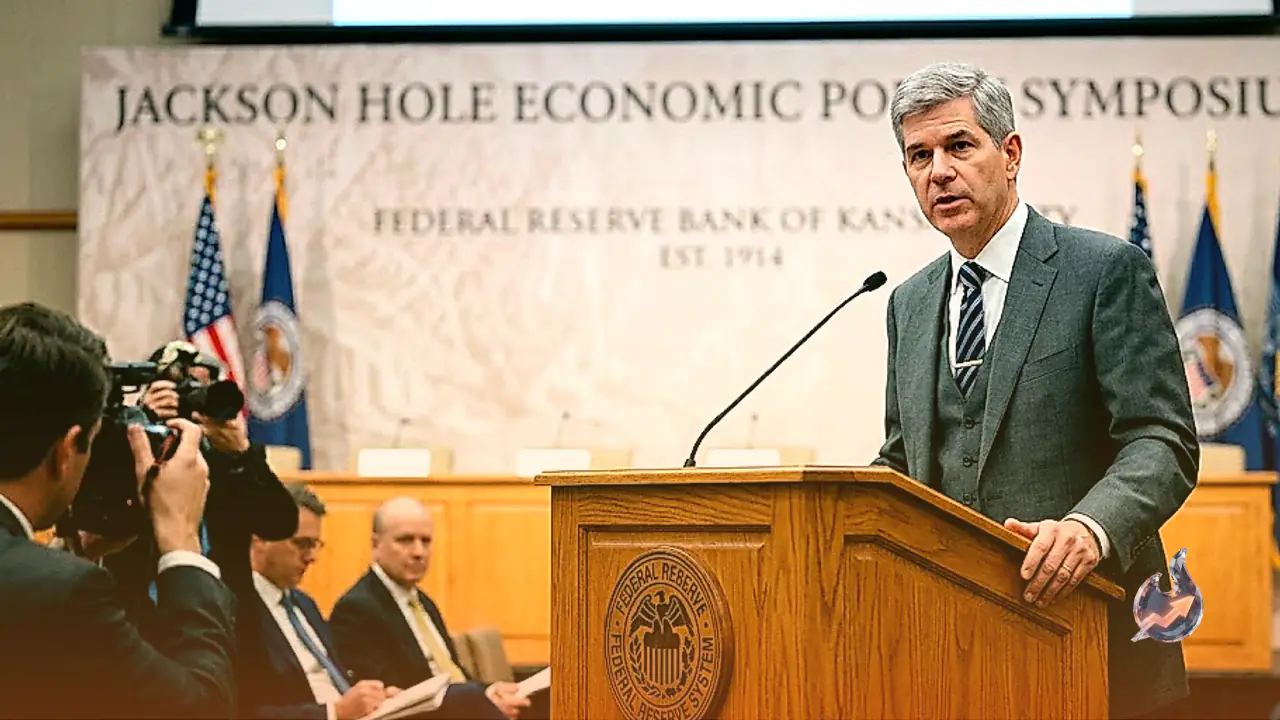
Beyond energy markets, global financial assets experienced significant volatility driven by monetary policy signals from the United States. The US Dollar mounted a strong broad-based rally following a hawkish address by Chair Warsh at the Jackson Hole Symposium, coupled with the release of the US NFP Annual Revision showing a downward adjustment of -79K jobs. The surging Greenback triggered notable downside pressure across major currency pairs and precious metals.
The British Pound (GBP/USD) extended its weekly corrective decline, receding toward the 1.3530 zone on Friday under sustained selling pressure. Simultaneously, EUR/USD accelerated its fall, dropping to seven-day lows in the sub-1.1600 territory as traders adjusted their rate expectations in response to Chair Warsh's firm policy stance. In commodity markets, Gold faced intensifying downward momentum, sliding to weekly lows near its critical 200-day Simple Moving Average (SMA) around $4,530 per troy ounce. The metal's retreat was amplified by a widespread rebound in US Treasury yields as market participants re-evaluated the likelihood of a Federal Reserve interest rate hike in September.
Record Diesel Crack Spreads and Cryptocurrency Retrenchment
While crude oil prices have shown relative stability, refined product markets are signaling severe structural tightness. The US diesel crack spread, representing the price premium of ultra-low sulphur diesel (ULSD) futures over WTI crude, surged past $100 per barrel for the first time on record, hitting an intraday peak slightly above $102.00. This unprecedented spread highlights acute refining constraints and elevated transport fuel costs, which threaten to feed into logistics chain inflation globally.
Cryptocurrency markets also succumbed to the broader risk-off environment and Dollar strength. Bitcoin fell back below the $80,000 threshold on Friday after a second unsuccessful attempt to breach overhead resistance between $81,000 and $82,000. Major altcoins mirrored Bitcoin's weakness: Ethereum (ETH) dropped toward $2,500, while Ripple (XRP) retreated toward key support around $1.40.
Central Bank Policy Watch and Natural Gas Live Technical Snapshot
Investors are now closely monitoring upcoming economic indicators, including the US ISM PMI and monthly Non-Farm Payrolls (NFP) data, which are expected to dictate near-term Dollar momentum. Among central banks, the Reserve Bank of New Zealand (RBNZ) is expected to raise interest rates, with market focus centered on its forward guidance. Conversely, the Bank of Canada (BoC) is anticipated to keep rates on hold, leaving traders to debate whether rate hikes could re-enter the agenda in 2027.
In live trading, Natural Gas (NG=F) traded around $2.88 per MMBtu, down 1.07% from its previous close of $2.91, remaining within its 52-week range of $2.48 to $7.83. Technical indicators show a neutral-to-cautious picture: the 14-period RSI sits at 55, while the MACD histogram shows mild bullish divergence at 0.03 (MACD line -0.01 versus signal line -0.03). Price action remains contained within Bollinger Bands spanning $2.63 to $2.90. Natural Gas trades below its 200-day Exponential Moving Average (EMA200) of $3.23 and 50-day Simple Moving Average (SMA50) of $2.92, maintaining a long-term bearish posture under a 50/200-day death cross, with immediate pivot support at $2.83 (S1) and resistance at $2.93 (R1).