























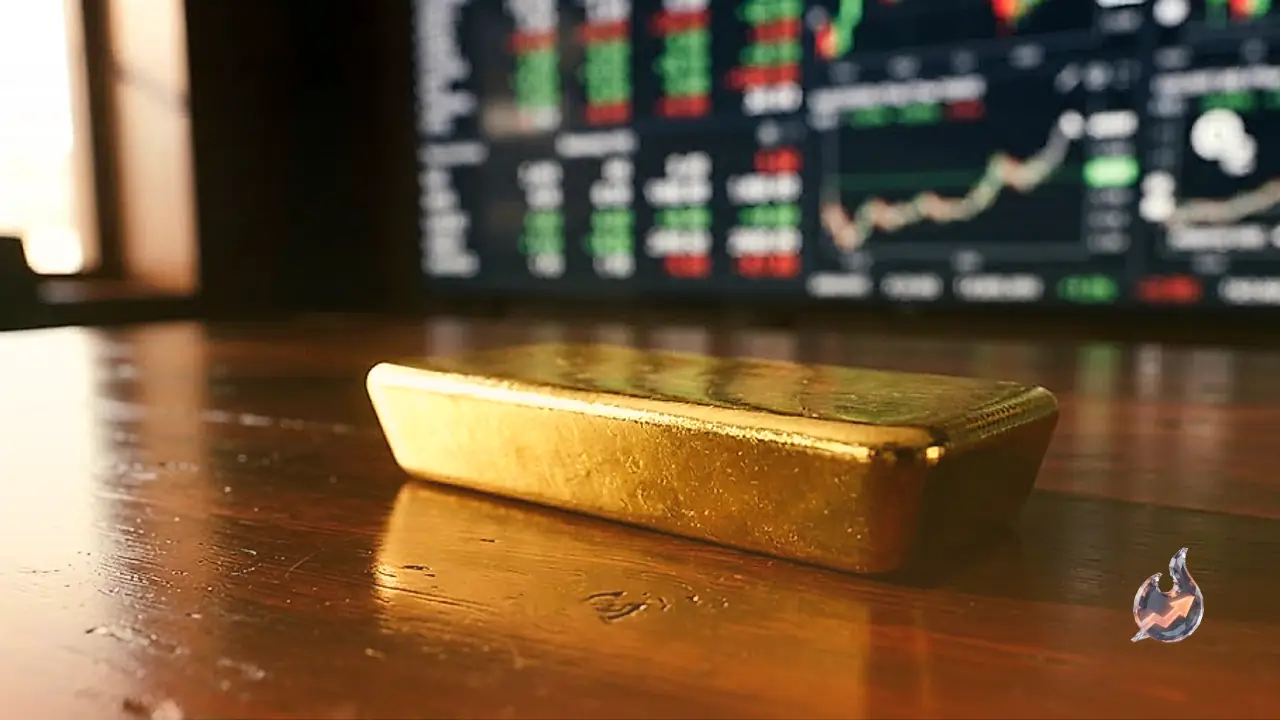

Spot gold prices staged a decisive comeback from session lows, recovering over 1% to trade above the $4,061 mark after touching an intra-day trough of $3,989 per ounce. According to recent market close data, gold ended the session at $4,074 per ounce, representing a 0.88% gain over its previous close of $4,038. The yellow metal found renewed buying interest despite concurrent gains in the US Dollar and Treasury yields, driven primarily by falling energy costs and persistent geopolitical concerns in the Middle East.
Oil Market Pullback and Geopolitical Catalysts
A key factor supporting the precious metal's upward movement was the retracement in energy prices. West Texas Intermediate (WTI), the US crude benchmark, dropped more than 1% to $100.05 per barrel after having climbed past the $100 threshold earlier in the week. The pullback in oil provided welcome relief regarding energy-driven inflationary pressures. However, geopolitical risks remained elevated as diplomatic discussions between Washington and Tehran stalled. Reports indicating potential strategic escalations involving US and Israeli posture toward Tehran post-elections have kept investors cautious, bolstering safe-haven demand for bullion.
US Macroeconomic Indicators and Corporate Capital Expenditure
Economic data out of the United States presented a mixed backdrop for financial markets. The Conference Board's Consumer Confidence Index showed a marked improvement in October, climbing to 91.7 from a previous reading of 84.2, as households expressed greater optimism regarding labor market prospects and overall business climate. Long-term inflation expectations remained stable at 5.8%. Conversely, residential housing data disappointed consensus forecasts, though its impact on broader asset pricing was muted.
On the industrial side, Durable Goods Orders for September jumped 1.8%, recovering strongly from the prior month's muted 0.1% reading. This surge was primarily propelled by sustained enterprise spending on artificial intelligence (AI) infrastructure. Meanwhile, labor market dynamics showed signs of gradual moderation, with the 4-week moving average of the ADP Employment Change easing to 16.8K from a revised previous figure of 17.5K.
Federal Reserve Interest Rate Expectations
Market attention remains tightly focused on the Federal Reserve's upcoming policy path. Pricing from Prime Terminal indicates an 83% probability of a 25-basis-point interest rate increase at the Fed's December meeting, down from 90% registered in the preceding week. Market participants are also awaiting critical macro inputs scheduled for release, including preliminary US Gross Domestic Product (GDP) growth figures and the core Personal Consumption Expenditures (PCE) Price Index, which serves as the central bank's preferred inflation gauge.
Technical Structure and Key Price Thresholds
From a technical perspective, gold faces initial trendline resistance near $4,100, extending from September highs. A sustained move above this level would open the pathway toward $4,200. Additional overhead hurdles reside at the 100-day Simple Moving Average (SMA) of $4,219 and the 50-day SMA at $4,288. Live technical indicators depict an RSI(14) reading of 39 alongside a bearish MACD histogram of -64.98 versus its signal line (-60.30). The Average True Range (ATR) stands at $77.41, reflecting ongoing daily volatility.
Should sellers force prices below the $4,000 round-number handle, immediate downside support lies at last week's low of $3,975. Secondary structural supports are identified at the July 17 low of $3,959 and the year-to-date low of $3,941. On an intraday basis, immediate pivot support S1 sits at $4,024, while resistance R1 is pegged at $4,102.
Central Bank Accumulation and Fundamental Mechanics
Gold continues to maintain its historical role as a primary store of value and hedge against currency debasement and inflation. As a non-yielding asset, bullion typically benefits from lower real interest rate regimes, whereas rising capital costs tend to exert downward pressure on prices. Furthermore, central banks globally continue to utilize gold to diversify foreign currency reserves. Data from the World Gold Council reveals that central banks purchased a record 1,136 tonnes of gold valued at approximately $70 billion in 2022, led by sustained reserve accumulation in emerging economies including China, India, and Turkey.
Gold typically maintains an inverse correlation with the US Dollar and US Treasury obligations. When the US Dollar softens or broader risk assets encounter market pullbacks, gold frequently attracts capital allocation as an independent financial shelter.
Foreign Exchange and Cryptocurrency Market Developments
Broader financial markets reflected cautious sentiment across asset classes. The Australian Dollar (AUD/USD) advanced to 0.7030 during Asian trading hours, buoyed by hawkish monetary policy expectations surrounding the Reserve Bank of Australia (RBA) ahead of domestic inflation data. Conversely, the Japanese Yen remained under pressure against the US Dollar (USD/JPY), which pushed toward a two-week high on expectations that the Bank of Japan (BoJ) may delay aggressive policy tightening.
The US Dollar Index (DXY) climbed 0.6% over a three-day span, crossing above 102.00 as investors sought liquidity ahead of the FOMC announcement. In cryptocurrency markets, major digital assets experienced mild consolidation, with Bitcoin (BTC) trading below the $80,000 threshold, Ethereum (ETH) displaying a neutral-to-bearish stance, and Ripple (XRP) holding near $1.30.