





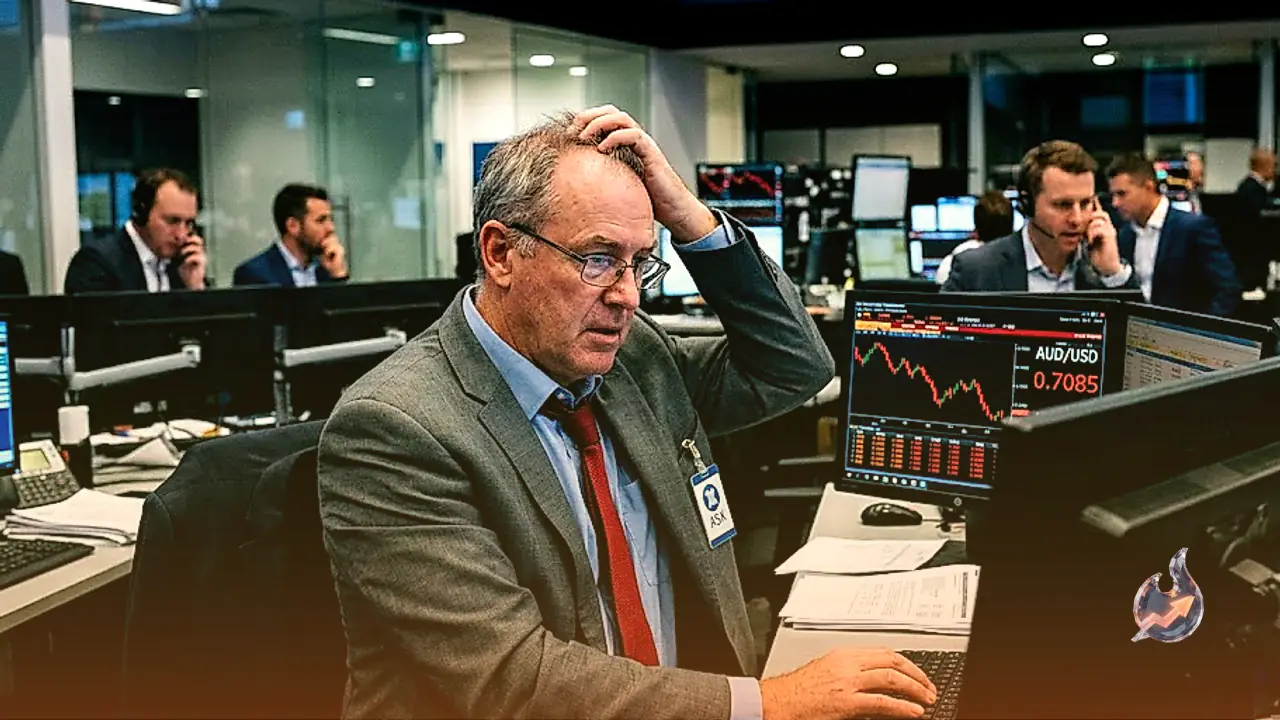



















Gold prices faced a sharp reversal midweek as surging sovereign bond yields and a rallying greenback undermined demand for non-yielding bullion. The benchmark 10-year US Treasury yield climbed 15 basis points to touch 5.12%, while the US Dollar Index (DXY) advanced 0.7% to trade at 101.22. This aggressive repricing across financial markets snapped bullion's two-day recovery run, pulling prices beneath the key $4,300 per troy ounce threshold.
Federal Reserve Policymakers Signal Further Rate Hikes
The aggressive move in rates follows the Federal Reserve's recent decision to raise the federal funds rate by 25 basis points, aimed at curbing economic accommodation. More importantly, the central bank's updated dot plot projections indicated that a clear majority of policymakers anticipate at least one additional rate increase before the close of the calendar year. A series of hawkish public remarks from regional Federal Reserve leaders throughout the week reinforced that outlook.
Neel Kashkari of the Minneapolis Fed initiated the rhetoric by emphasizing that inflationary pressures remain uncomfortably elevated across virtually all segments of the domestic economy. Alberto Musalem of the St. Louis Fed concurred, noting that additional monetary tightening is likely required to sustainably rein in consumer prices. Austan Goolsbee of the Chicago Fed also pointed out that persistently robust aggregate demand could continue adding upward pressure to inflation.
The hawkish narrative continued as Susan Collins of the Boston Fed warned of stubborn inflation risks while defending the recent rate increase. Thomas Barkin of the Richmond Fed cautioned that inflationary shocks often require extended timeframes to dissipate, and Fed Governor Michael Barr stated that further rate hikes will probably be required. Consequently, interest rate pricing shifted dramatically, with Prime Terminal data revealing that money market expectations for an October rate increase climbed to 66% from 52% in the prior session, with broader estimates reaching near 70%.
Strong PMI Gauges Propel the Greenback
Reinforcing the case for higher-for-longer borrowing costs, fresh economic data from S&P Global showed that business activity accelerated meaningfully in September. The preliminary manufacturing PMI came in at 57.0, outperforming the projected 53.5 and rising from August's 53.9 print. The services sector reflected similar resilience, jumping from 56.5 to 58.7 to easily surpass consensus estimates. This lifted the composite PMI from 56.0 to 58.4, confirming broad-based economic momentum across the private sector.
The robust macroeconomic backdrop provided substantial momentum to the US Dollar Index against a basket of six major peers. Because precious metals are quoted internationally in dollars, a surging greenback directly increases acquisition costs for foreign market participants, curbing spot demand and prompting speculative liquidation.
Energy Export Curbs and Geopolitical Developments
Commodity markets also digested significant policy discussions within Washington. Disclosures indicated that the Trump administration is outlining a proposal to halt diesel fuel exports for a duration of 90 days, seeking to suppress domestic energy prices. Crude oil futures eased slightly following the headline, which further reinforced the greenback's relative yield appeal.
Concurrently, market anxiety surrounding the confrontation between the United States and Iran softened at the margins. Dispatches noted that a senior Iranian official confirmed Tehran is evaluating Washington's response to an initiative aimed at concluding hostilities. While the prospect of diplomatic de-escalation reduced bullion's safe-haven premium, broader financial markets maintained a cautious stance ahead of the highly anticipated summit between Donald Trump and Xi Jinping.
Technical Indicators Signal Near-Term Downside Momentum
From a chart perspective, spot gold faltered directly beneath the upper boundary of a bullish wedge pattern before sinking through the confluence of its 100-day and 50-day Simple Moving Averages located at $4,313 and $4,306, respectively. The technical breakdown accelerated once the $4,300 handle gave way.
Live tracking data for gold futures (GC=F) places the price at $4,322, down 1.25% from the previous close of $4,376, against a 52-week trading span of $3,750 to $5,586. The Relative Strength Index (RSI-14) stands at 42, reflecting expanding bearish control beneath the neutral 50 line. The Moving Average Convergence Divergence (MACD) registers at -13.57 against a signal line of 5.57, producing a negative histogram reading of -19.14. Moving averages present a challenging ceiling: the 20-day EMA sits at $4,411, the 50-day EMA is at $4,389, and the 200-day EMA stands at $4,431. The 50-day SMA is located at $4,343, while the 200-day SMA rests at $4,555, exhibiting a bearish death cross condition with the medium-term average below the long-term benchmark.
The Bollinger Bands (20, 2) delineate an active boundary between $4,260 and $4,625, with the middle line at $4,443. The 14-day Average True Range (ATR) indicates daily volatility of $103.65. Floor traders highlight a pivotal level at $4,347, with initial support (S1) at $4,286 and secondary support (S2) at $4,250, alongside a wider 20-day base around $4,273. On any prospective rebound, resistance emerges at $4,383 (R1) and $4,443 (R2), with additional structural barriers standing near the $4,365-$4,370 wedge trendline, followed by $4,400 and $4,500.
Central Bank Reserves and Fundamental Inflows
Despite short-term cyclical drawdowns triggered by monetary tightening, bullion remains an essential reserve cornerstone. Unlike fiat currencies, gold carries zero credit or counterparty risk, serving as an ultimate safeguard against sovereign currency depreciation and structural inflation.
Central banks represent the single largest institutional category of gold holders, utilizing bullion reserves to reinforce public confidence in their national solvency. According to World Gold Council disclosures, official monetary institutions accumulated 1,136 tonnes of gold valued at approximately $70 billion during 2022, marking the highest volume of net annual sovereign additions on record. Monetary authorities across emerging markets, specifically China, India, and Turkey, continue to steadily expand their gold stockpiles to insulate their balance sheets from global financial volatility.
Cross-Asset Movements in Currency Markets
Developments across foreign exchange markets mirrored the broader shift in macro sentiment. The Bank of Japan raised its short-term policy interest rate target from 1.00% to 1.25% in a 7-2 voting outcome, continuing its gradual policy normalization in line with prevailing consensus expectations. Despite the hike, the US dollar maintained its ascendancy, keeping USD/JPY hovering near the mid-157.00 region. Meanwhile, AUD/USD dropped toward the 0.7100 handle during Asian trading hours as softer Australian flash PMIs revealed contracting manufacturing activity and decelerating services growth, illustrating how strong US macro data continues to dominate global currency pairs.