


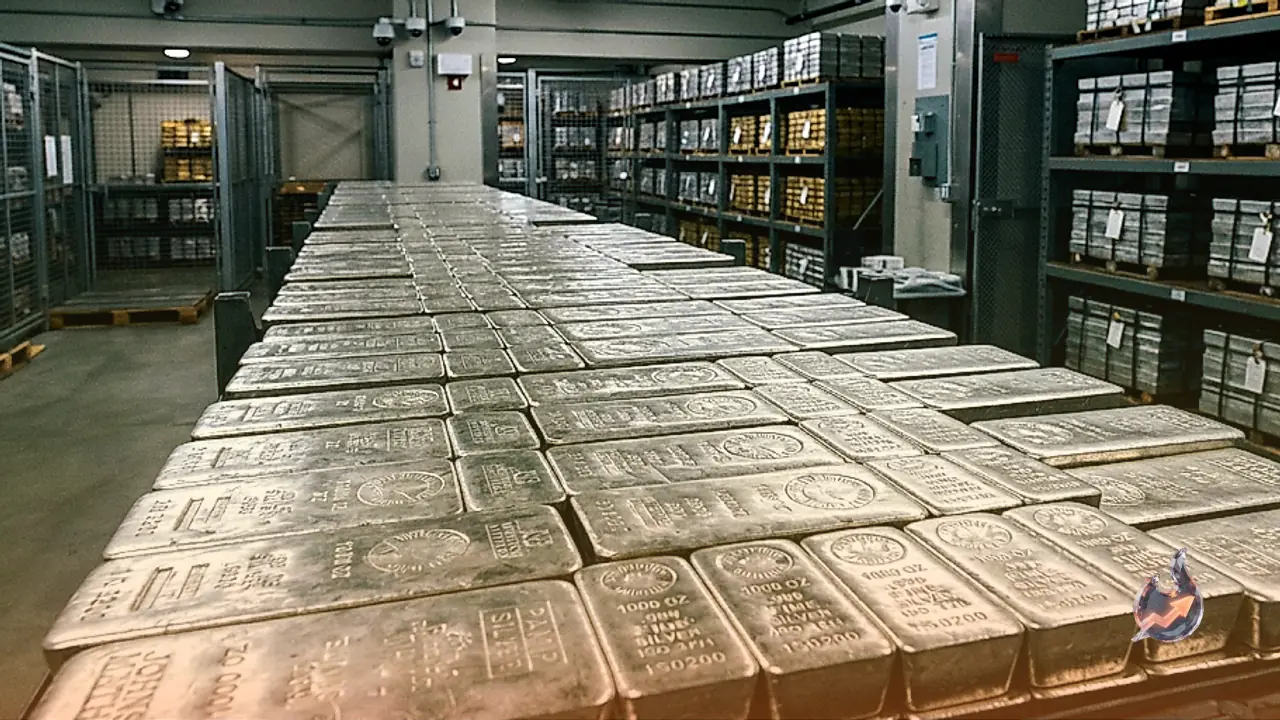
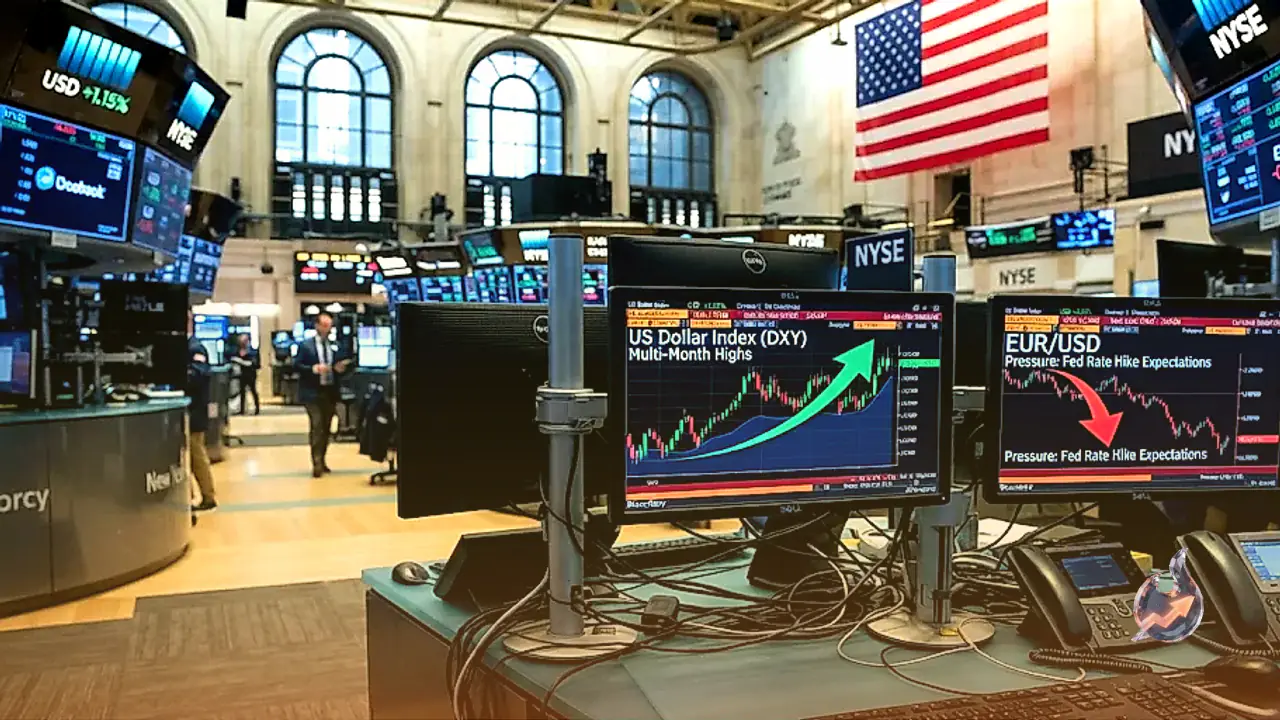



















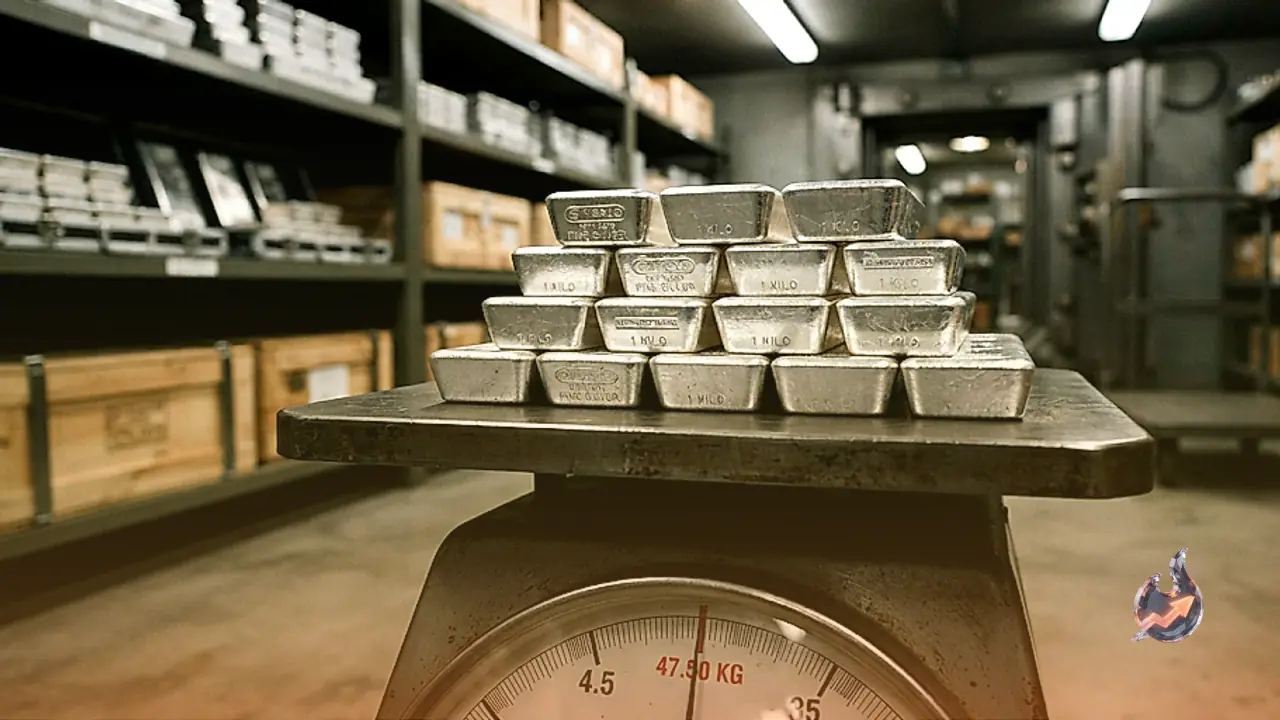

Silver prices have suffered a third consecutive trading session of losses as firming expectations of further Federal Reserve interest rate hikes continue to bolster the US Dollar. The broader bearish fundamental and technical backdrop triggered a decisive movement in XAG/USD below the $47.50 level, marking a fresh year-to-date low. Technical chart configurations indicate that the path of least resistance remains tilted to the downside, with temporary relief rallies expected to face aggressive selling pressure.
Technical Indicators Signal Intact Bearish Momentum
Following repeated failures to break above the 100-period Exponential Moving Average (EMA) on the 4-hour chart, a clear breakdown under the $51.00 psychological threshold triggered accelerated technical selling. Momentum oscillators on the lower timeframes reinforce this negative bias. The Moving Average Convergence Divergence (MACD) indicator remains entrenched below the zero line at -0.30, validating the underlying strength of the downtrend.
However, the Relative Strength Index (RSI) has declined to 23.83, moving deep into oversold territory. While an oversold RSI suggests that immediate downside momentum could stall or prompt a short-term corrective rebound, it does not imply a full trend reversal. Any upward recovery attempt will encounter immediate technical hurdles around the daily swing high near $47.85, followed by the $48.00 mark. Higher resistance levels are positioned at $48.65 and $49.00, keeping XAG/USD vulnerable to further declines as long as it trades below key moving average barriers.
Fundamentals, Industrial Usage, and Gold Ratio Dynamics
Silver functions both as a monetary store of value and an indispensable industrial commodity. Investors frequently utilize physical bullion, coins, bars, or Exchange Traded Funds (ETFs) to diversify investment portfolios and hedge against long-term inflation. Because Silver is non-yielding and priced globally in US Dollars (XAG/USD), rising bond yields and a stronger greenback inherently cap its upside potential.
Beyond macroeconomic factors, industrial demand plays a dominant role in Silver's price discovery. Possessing the highest electrical conductivity of all metals, Silver is heavily utilized in electronics manufacturing and the rapid expansion of solar energy infrastructure. Industrial output in the United States and China directly drives raw material consumption, while consumer demand for silver jewellery in India provides a vital physical demand floor. Furthermore, Silver closely tracks Gold price movements. The Gold/Silver ratio, which measures how many ounces of silver are required to purchase one ounce of gold, continues to serve as an indicator for relative valuation between the two precious metals.
Broader Market Impact: Gold, Currencies, Bitcoin, and Equities
The weakness in Silver mirrors broader market corrections across multiple asset classes under the weight of elevated US interest rate expectations
- Gold (XAU/USD): Precious metal prices weakened further below $3,850 during early trading, hitting their lowest level since early October 2025 due to US Dollar strength and Middle East geopolitical uncertainties.
- AUD/USD: The currency pair consolidated below 0.6800, remaining near its lowest level since January following disappointing October Retail Sales and Industrial Production data out of China.
- USD/JPY: The pair drifted toward 159.50 even as Japan's economy unexpectedly contracted by 0.1% in Q3, with markets remaining cautious over potential Japanese currency intervention.
- Bitcoin (BTC): The digital asset struggled below $65,200 after touching a multi-month low of $62,006. Spot Bitcoin ETFs logged a second consecutive week of billion-dollar net outflows.
- US Financial Markets: Beneath index stability, US Treasury yields posted their sharpest weekly rise in more than two years, while Nvidia shares experienced their worst weekly loss since April 2025.