

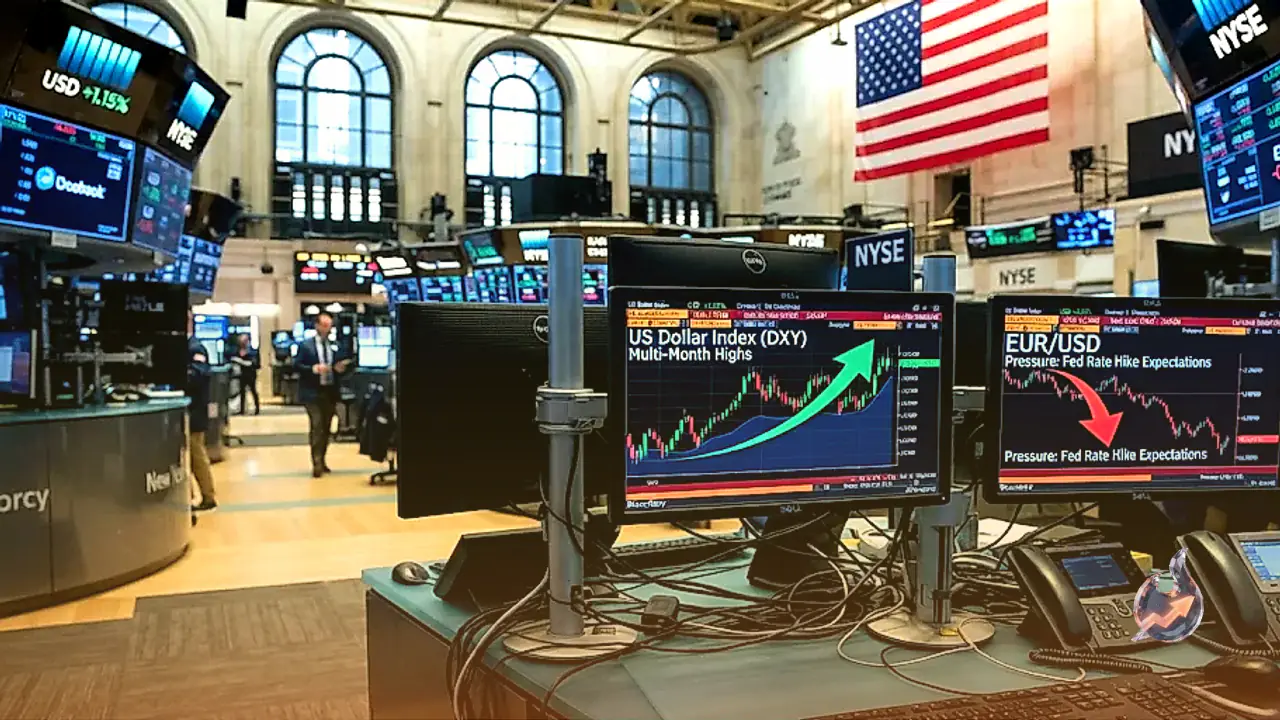





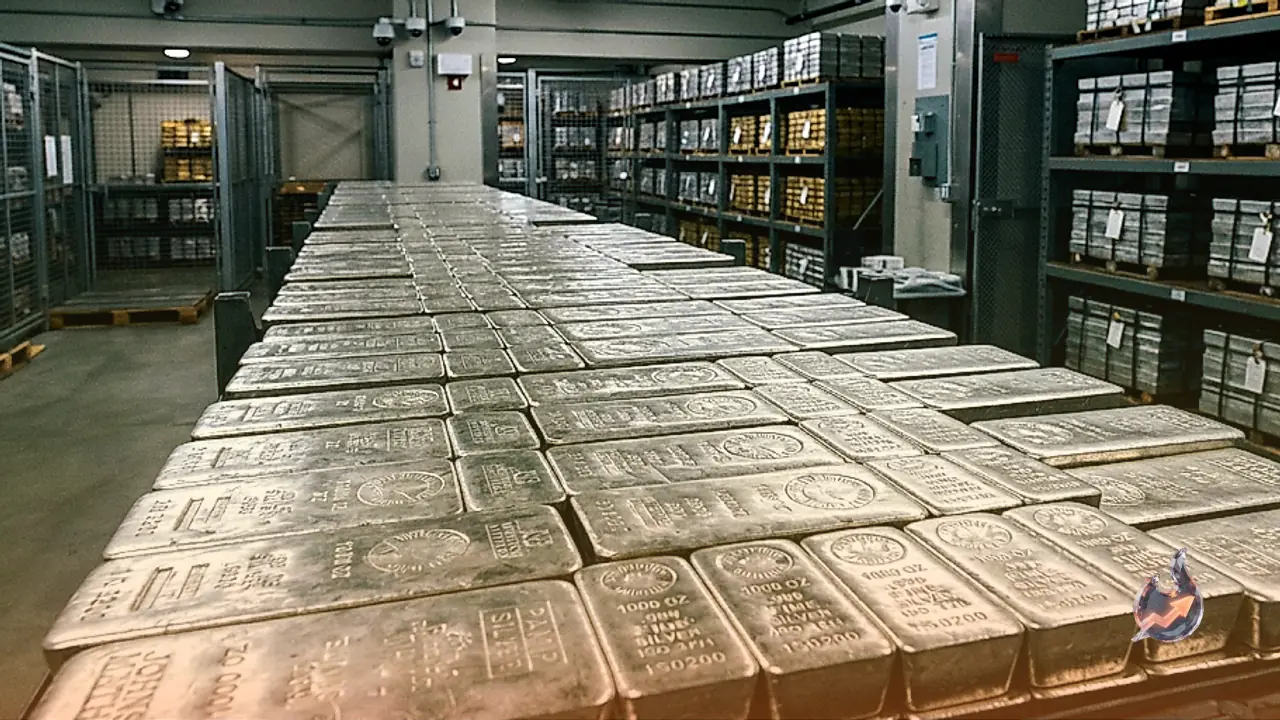
















Global financial markets are witnessing renewed selling pressure across precious metals and broad asset classes. Recent market assessments reveal that the brief recovery in silver prices is fading rapidly as physical supply constraints show signs of easing. High US Treasury yields and a robust US Dollar continue to restrict any sustained upside for precious metals, creating a challenging environment for bullion investors.
Silver Supply and Demand Dynamics
Projections from the Silver Institute and Metals Focus indicate that while the silver market is set to log its sixth consecutive annual supply deficit in 2026, the shortfall is projected to contract noticeably. The deficit is expected to narrow to 35 million ounces in 2026, down from 54 million ounces in 2025. This reduction in the supply deficit suggests that physical market tightness alone may no longer be enough to spark a prolonged rally.
On the demand side, total global silver consumption is forecast to drop by 5%. Industrial demand has faced headwinds due to reduced intake from the photovoltaic (solar) manufacturing sector alongside increased material substitution by industrial users. While non-solar industrial demand has shown steady resilience, overall physical market tightness has eased further due to consistent capital outflows from silver-backed exchange-traded products (ETPs).
Technical Indicators and Crucial Price Levels
Technical chart patterns indicate that the brief bullish momentum observed on daily charts has broken down. The Relative Strength Index (RSI) has dropped to 31, signalling prevailing downside risks. Live market data shows silver trading near $47.73 per ounce, reflecting a 2.65% decline on heavy volume.
Technical analysts highlight critical price thresholds for silver in the near term. Immediate downside support is pegged between the $45 and $46 zone. A breach below this region could open the door for deeper corrections. Conversely, upside resistance sits at $53, aligning with the 21-day moving average (21 DMA), followed by a secondary resistance cap at $55. Until prices decisively reclaim these resistance boundaries, price rebounds remain vulnerable to aggressive short-selling.
Macroeconomic Drivers and US Dollar Strength
For silver to engineer a meaningful recovery, broader macroeconomic conditions need to shift favorably. Persistent strength in the US Dollar Index and elevated US Treasury yields remain the primary obstacles preventing precious metals from gaining upward traction.
Analysts note that a sustained turnaround in silver will likely require three key developments: a further slowdown in US inflation metrics, a pullback in global crude oil prices, and a decline in benchmark US bond yields. Additionally, a reversal in ETP flow trends—shifting from net outflows back to sustained inflows—will be necessary to signal renewed institutional confidence in the metal.
Foreign Exchange Movements: AUD/USD and USD/JPY
The strength of the US Dollar is echoing across global foreign exchange markets. The AUD/USD currency pair remained subdued below the 0.6800 handle, trading near its lowest levels since January. Weaker-than-expected October Retail Sales and Industrial Production figures out of China have disproportionately impacted the Australian Dollar, which serves as a liquid proxy for Chinese economic growth. Ongoing US-Iran geopolitical tensions have further buoyed greenback demand.
Meanwhile, the USD/JPY pair hovered near 159.50 despite fresh government data revealing that Japan’s economy unexpectedly contracted by 0.1% in the third quarter. The Japanese Yen managed to find modest support from market intervention warnings issued by Tokyo authorities. However, firm market expectations of upcoming Federal Reserve interest rate hikes continue to keep the US Dollar near 19-month highs, offering underlying support to the pair.
Broader Asset Trends: Gold, Bitcoin, and Stock Signals
Gold prices extended their slide below the $3,850 mark during European trading hours, touching levels not seen since early October 2025. The combination of hawkish Federal Reserve rate expectations and geopolitical friction in the Middle East has driven investors into the US Dollar, undercutting non-yielding bullion assets.
In the digital asset space, Bitcoin (BTC) continues to trade under pressure below $65,200, after testing a multi-month low of $62,006 last week—its lowest point since mid-July. Persistent institutional liquidation has weighed on prices, with spot Bitcoin ETFs registering a second consecutive week of outflows exceeding $1 billion.
Across equity markets, while benchmark stock indexes posted a positive weekly close, three significant inter-market breakdown signals emerged simultaneously. US Treasury yields experienced their sharpest single-week surge in over two years, Nvidia (NVDA) endured its worst weekly loss since the tariff-driven selloff of April 2025, and spot gold settled at its lowest weekly close in over a year. Together, these signals highlight rising underlying volatility across global financial markets.