
























Selling pressure across the precious metals space gathered fresh momentum as the white metal retreated toward its lowest territory since early August, undercut by a robust greenback and a multi-year surge in sovereign debt returns. Trading under the international currency ticker XAG/USD, silver remained firmly capped below its 50-day, 100-day, and 200-day Simple Moving Averages (SMAs). The alignment of all three primary moving averages above spot values continues to reinforce an overhead technical ceiling, tilting near-term directional momentum heavily toward sellers as momentum gauges signal further caution.
Surging Treasury Yields and Dollar Strength Squeeze Bullion
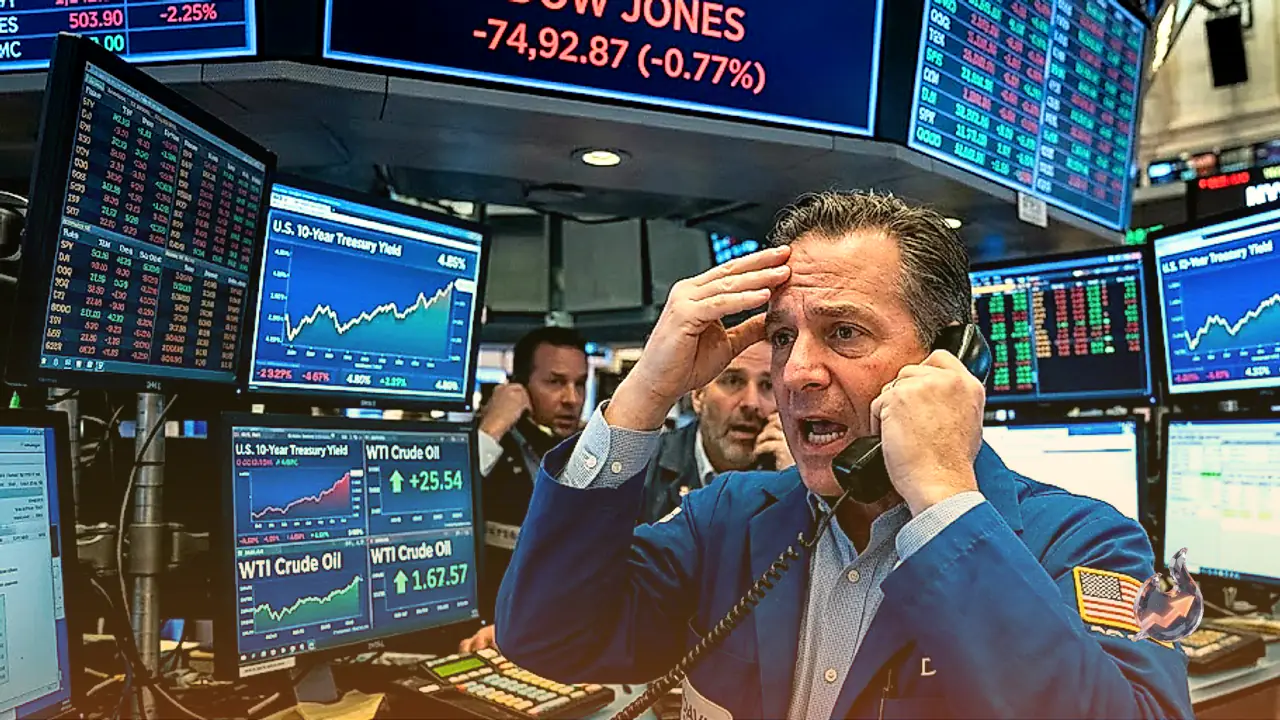
Macroeconomic headwinds intensified as the US 10-year Treasury yield climbed to 5.27 percent, marking its highest threshold since 2007. Because bullion offers no nominal yield, rising returns on fixed-income government obligations substantially elevate the opportunity cost of holding non-yielding hard assets. At the same time, the US Dollar Index (DXY) held steady near 101.25, hovering just below a two-month peak. With industrial and precious commodities priced primarily in greenbacks, an elevated dollar places an immediate premium on purchases by international investors, dampening overall cross-border appetite and softening baseline spot values.
Daily Chart Configurations and Fibonacci Pivot Zones
From a chartist perspective, XAG/USD remains entrapped beneath a dense cluster of overhead technical obstacles. The 50-day Simple Moving Average resides at $63.88, the 100-day SMA tracks at $65.65, and the broader 200-day SMA stands at $73.19. All three technical gauges are serving as formidable overhead resistance barriers, maintaining a distinct downward tilt. Compounding this setup, the Relative Strength Index (RSI) highlights negative momentum as spot quotes test pivotal Fibonacci support markers situated near the $61 region.
On upward reactions, immediate supply emerges around the 50.0 percent Fibonacci retracement anchor at $62.95. Beyond that barrier, the 50-day SMA at $63.88 and the 38.2 percent retracement level at $64.87 pose sequential hurdles. If buyers muster additional strength, the 100-day SMA at $65.65 and the 23.6 percent retracement at $67.26 form an intermediate resistance shelf before the $71.12 structural pivot and the 200-day SMA at $73.19 come into view. Conversely, downside trajectory reveals immediate structural support at the 61.8 percent Fibonacci retracement of $61.02. Further downside vulnerability exposes the 78.6 percent level at $58.27, followed by the prior cyclical trough around $54.77, a historic base where value seekers previously stepped in to arrest steep corrections.
Real-Time Technical Metrics and Volatility Profile
Live trading prints indicate silver changing hands at $60.87, representing a 0.57 percent decline from the preceding session close of $61.22. Across the prior 52-week trading span, quotes have fluctuated between a low of $45.38 and a high of $121.30. Daily trading participation was notable, with aggregate volume registering at 11.93 times the 20-day historical average.
Technical oscillators present a clear leaning: the 14-period RSI rests at 38, reflecting subdued velocity. The Moving Average Convergence Divergence (MACD) prints at -0.62 against a signal line of -0.06, producing a negative histogram of -0.56. Tracking trend health, the 20-day Exponential Moving Average (EMA) sits at $64.33, the 50-day EMA at $64.64, and the 200-day EMA at $67.09, while the 50-day SMA stands at $63.82 alongside a 200-day SMA of $72.66. The positioning of the 50-day EMA below the 200-day EMA establishes a recognized death cross, signaling a broader macro downtrend. Bollinger Bands (20,2) span from $61.27 to $68.17 around a midpoint of $64.72, with current price action settling below the lower band boundary. The 14-period Average Directional Index (ADX) clocks in at 14, denoting an underlying trend of weak intensity. Fast and slow stochastic lines stand at 2 and 9 respectively. The 14-day Average True Range (ATR) measures 1.55, establishing an empirical guide for volatility-based risk limits. Key intraday calculation metrics plot the central pivot at $60.96, resistance ceilings at R1 $61.16 and R2 $61.45, with downside support shelves identified at S1 $60.67 and S2 $60.47.
Investment Dynamics and Safe-Haven Properties
Silver has preserved a long heritage as an investable store of value and transactional medium. While commanding a smaller market footprint than gold, the metal serves as an accessible tool for portfolio diversification, wealth preservation, and an inflation hedge during periods of accelerating consumer prices. Market participants allocate capital across physical coins and minted ingots, or through financial derivatives and Exchange Traded Funds designed to mirror spot performance in global liquidity centers.
Pricing mechanisms reflect a diverse blend of monetary and real-economy drivers. Unsettled geopolitical conditions or deepening recessionary fears occasionally ignite safe-haven accumulation, though typically with less velocity than bullion counterparts. As an asset bearing zero yield, sustained reductions in benchmark interest rates tend to invigorate upside potential. Conversely, a resilient greenback constrains valuations, whereas foreign exchange softening historically unleashes upward momentum. Physical mine extraction rates, scrap metal reclaiming volumes, and structural supply dynamics also exert long-run influence on market balance.
Industrial Applications and the Gold-Silver Equilibrium
Unlike pure monetary metals, silver carries extensive real-world industrial demand. Boasting electrical conductivity superior to both copper and gold, the material is indispensable in microelectronics fabrication, advanced electrical contacts, and photovoltaic solar cell manufacturing. Fluctuations in heavy manufacturing output directly impact consumption: while structural shifts in the American and Chinese industrial complexes absorb sizable tonnage, Indian retail demand across seasonal jewelry and festive fabrication acts as an equally influential consumer catalyst.
Market correlation historically ties silver closely to broader moves in gold. When bullion rallies, silver frequently tracks higher due to overlapping safe-haven characteristics. Portfolio managers frequently evaluate the Gold/Silver ratio, which computes how many ounces of silver are required to match the value of a single gold ounce. An elevated ratio often indicates relative undervaluation for silver or premium pricing in gold, whereas a declining metric implies that gold has turned historically cheap relative to its sister metal.
Global Market Crosscurrents Across Currencies and Crypto
Cross-asset trends highlight a broader flight toward the dollar. The AUD/USD pair hovered near 0.7000 at the opening of the week, trading at its softest mark since August 4 as high energy prices, inflation worries, and mounting expectations of an October Federal Reserve rate hike bolstered the greenback ahead of the Reserve Bank of Australia policy update. Concurrently, USD/JPY found supportive demand after earlier retreats sparked by official intervention speculation, aided by a dovish Bank of Japan policy summary and energy inflation pressures that carried the pair back toward 158.00.
Gold mirrored the broader slump across commodities, retreating toward $4,100 per troy ounce, a level not touched since early August. Elevated Treasury yields and a rising dollar eclipsed the underlying geopolitical bid. In digital assets, Bitcoin held beneath $82,800 after posting a 4 percent weekly gain, moderating slightly below recent peaks even as institutional inflows via spot Exchange Traded Funds maintained an underlying bid. Energy markets remained strained with UK diesel touching historic peaks. Both the Federal Reserve and the Bank of Japan recently delivered 25-basis-point interest rate increases, with each monetary authority affirming that subsequent adjustments will hinge entirely on incoming macro prints.