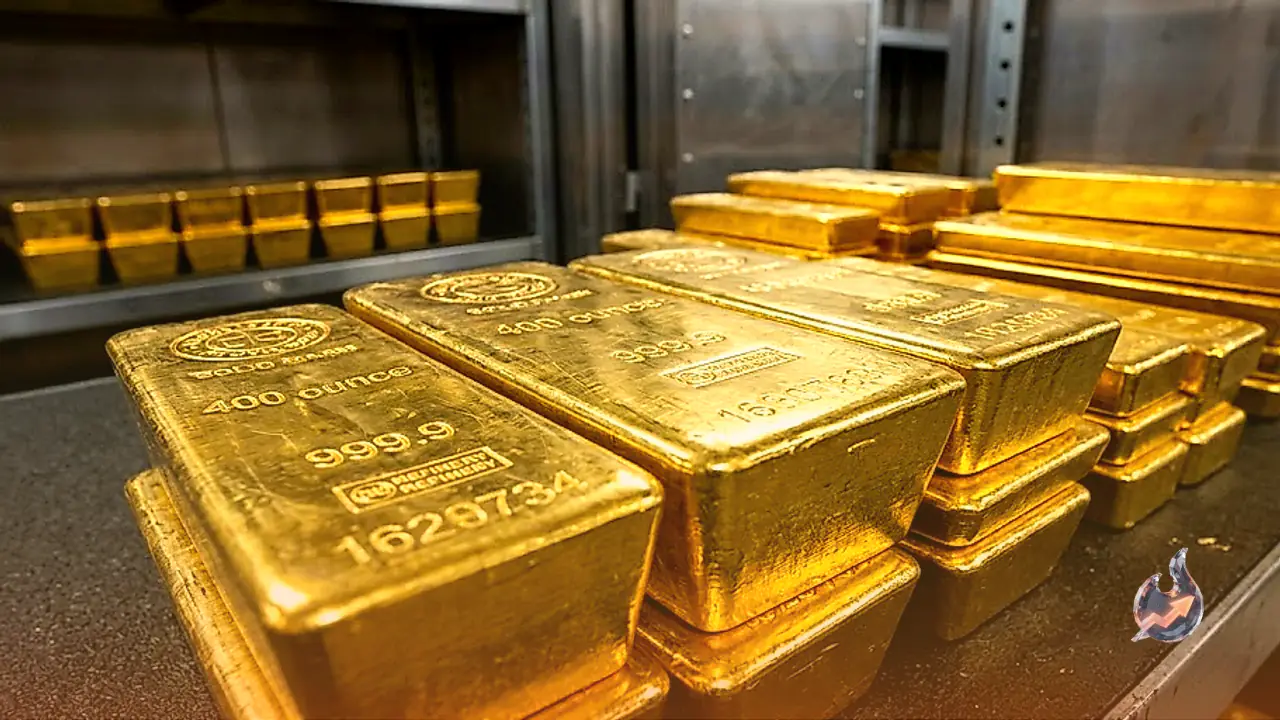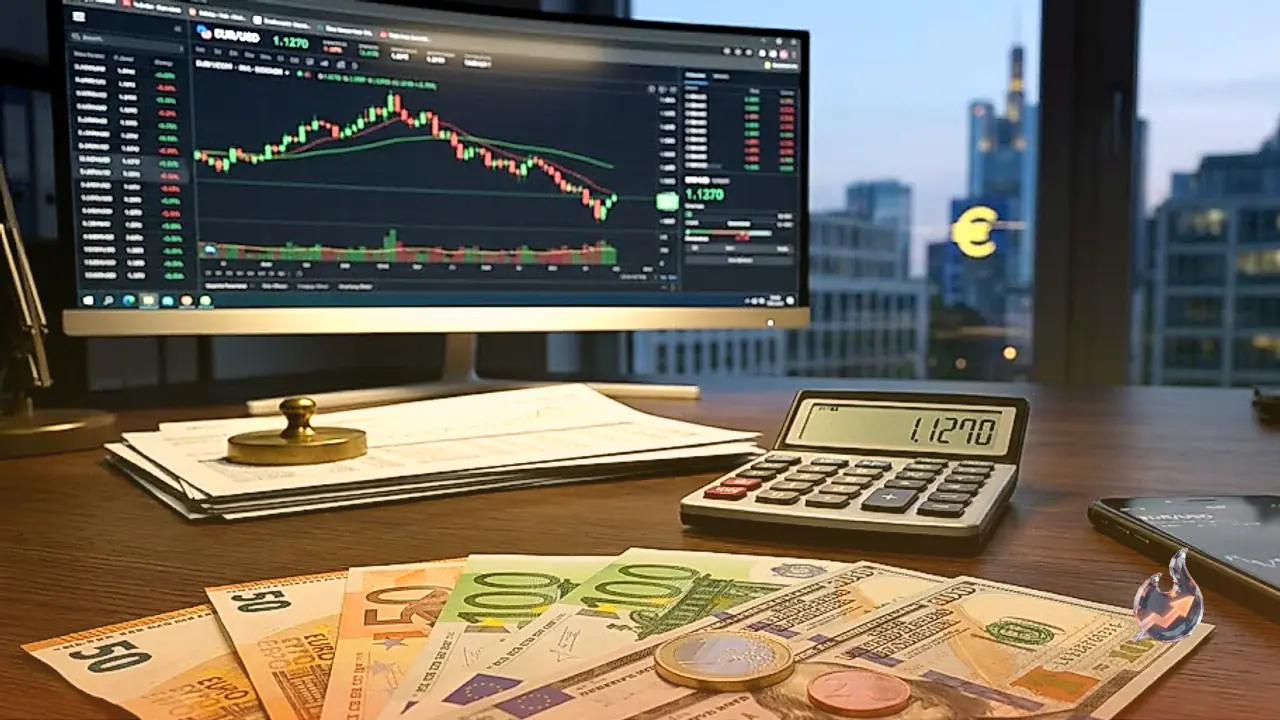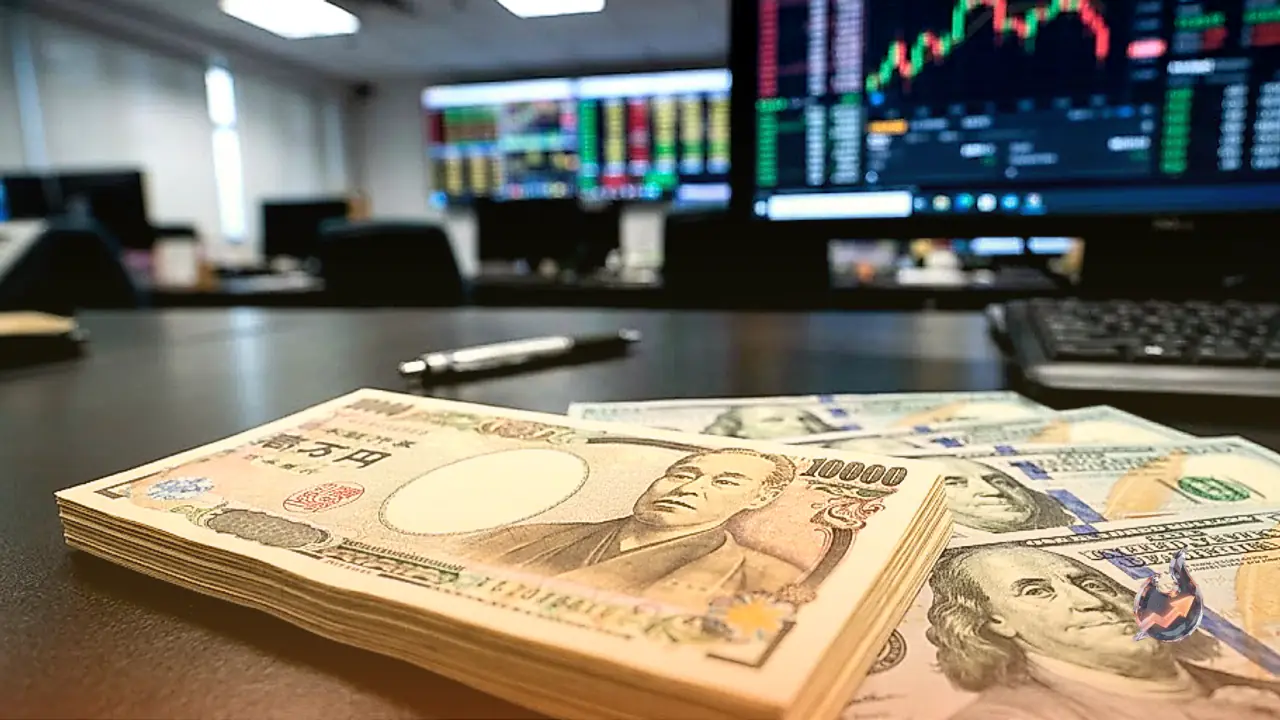








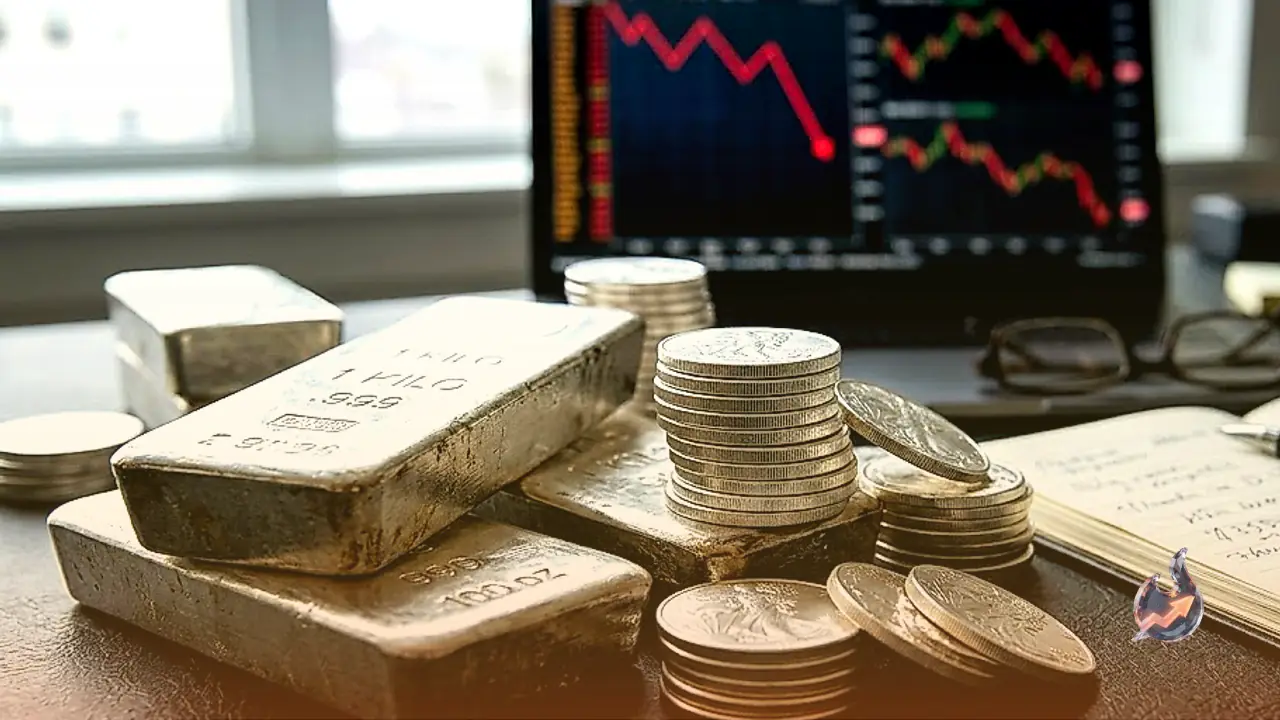















Selling pressure across the precious metals space has intensified, pushing silver below the key psychological threshold of $54.00 per ounce as it drifts toward 11-month lows. In recent trading, the white metal touched $53.60, representing a 0.94 percent decline from its prior close of $54.11. Market participants suggest that the commodity may find some temporary footing due to dip-buying by bargain hunters alongside retreating crude oil valuations, although broader technical structures continue to point toward persistent weakness.
Geopolitical Negotiations and Cooling Inflation Worries
Diplomatic initiatives across regional powers have provided a measure of relief to energy markets. Security discussions involving Iran, Saudi Arabia, Pakistan, and Turkey have helped temporarily soothe immediate inflation fears. When perceived supply disruptions ease, crude oil benchmarks tend to drift lower. This drop in energy costs directly influences bullion demand, dampening the urgency among market players to establish safe-haven inflation hedges.
Central Bank Decisions Keep Market Participants on Edge
Global financial attention is firmly trained on several major monetary authorities preparing policy announcements. Market expectations lean toward an interest rate pause from the Federal Reserve during its October gathering. Simultaneously, policy updates are scheduled from the European Central Bank (ECB), Bank of Japan (BoJ), and Bank of Canada (BoC). In total, five of the world's leading central banks are slated to reveal their interest rate paths this week, leaving investors mindful of elevated borrowing costs as energy disruptions keep inflation metrics above targeted bands. Meanwhile, the US Dollar approaches a critical juncture leading into the November 3 midterm elections, where congressional outcomes could dramatically shift fiscal policy trajectories and subsequently reshape US monetary policy expectations heading into 2027.
Technical Indicators and Resistance Barriers
From a technical standpoint on the daily chart, silver encounters initial upside resistance at the nine-day exponential moving average (EMA) of $55.74. A considerably firmer ceiling stands at the 50-day EMA near $60.74, where buyers would need to force a decisive breakout to neutralize the prevailing downward momentum. Without clear immediate chart support directly below current quotations, the asset remains exposed to further pullbacks until market bulls can successfully reclaim the short-term moving average cluster.
Live tracking data highlights that the 14-day relative strength index (RSI) has settled at 30, placing the asset into oversold territory. The moving average convergence divergence (MACD) prints at -2.32 against a signal line of -1.97, yielding a bearish histogram reading of -0.35. Trend metrics reveal the 20-day EMA at $57.72, the 50-day EMA at $60.68, and the 200-day EMA at $67.08. With the 50-day EMA trailing below the 200-day EMA, a classic death cross formation remains active, affirming the extended downtrend. The 20-day Bollinger Bands span between $52.97 and $62.97 around a central band of $57.97. Trend strength is confirmed by an average directional index (ADX) of 35, while the stochastic oscillator displays a fast line of 1 and a signal line of 2. Daily volatility as measured by the 14-day average true range (ATR) stands at 1.23. The 20-day support sits near $53.56 with resistance around $61.62. Critical intraday pivot calculations position the central pivot at $53.81, overhead resistance targets R1 at $54.07 and R2 at $54.54, and downward cushions S1 at $53.34 and S2 at $53.08. Over the trailing 52-week cycle, silver has ranged between $45.85 and $121.30.
Currency Fluctuations and Gold Movements
Cross-market currency dynamics continue to exert influence over bullion valuation. In Asian trading on Tuesday, the AUD/USD pair attracted dip-buyers around 0.7000, halting the prior session's retreat from monthly highs amid speculation regarding a potential November interest rate hike by the Reserve Bank of Australia. Concurrently, the USD/JPY cross traded above mid-157.00 levels, supported by market views that the Bank of Japan may refrain from aggressive monetary tightening, even as traders maintained caution prior to upcoming policy announcements.
Gold encountered fresh selling interest during Tuesday's Asian hours, relinquishing a portion of its modest bounce from three-month lows. A slight rebound in US Treasury yields from a three-week trough bolstered the US Dollar, generating headwind for non-yielding assets. Even so, the yellow metal managed to preserve its ground above the $4,000 mark as sellers paused ahead of the Federal Reserve's rate determination.
Silver's Dual Role in Industry and Investing
Silver occupies a distinct role across international finance, serving both as an investment asset and an indispensable industrial input. Historically functioning as a store of value and exchange vehicle, it provides portfolio diversification and serves as an inflation buffer alongside gold. Investors routinely trade physical bars and coins, or access market exposure through exchange-traded funds (ETFs) tracking international benchmarks.
Valuation swings are driven by a variety of drivers. Macroeconomic anxiety or severe recessionary threats frequently prompt safe-haven flows, though gold typically captures greater demand during acute crises. As an asset that produces no passive yield, lower interest rate environments generally support silver pricing. Pricing conventions in US Dollars (XAG/USD) also make currency shifts pivotal: greenback appreciation tends to cap upside progress, whereas dollar depreciation provides upward momentum. On the supply side, silver is substantially more abundant than gold, making mining volumes and scrap recycling efficiency important supply-side determinants.
Industrial consumption remains equally vital, especially across electronics and solar power generation, where silver's superior electrical conductivity surpasses both copper and gold. Structural economic trends across the United States, China, and India play decisive roles in shaping global demand. American and Chinese manufacturing complexes deploy silver heavily across advanced production processes, while Indian jewelry consumption remains a vital demand pillar. In analyzing relative value, market analysts track the gold-to-silver ratio, which gauges how many ounces of silver match the value of one ounce of gold. An elevated ratio frequently signals that silver is relatively undervalued compared to gold, while a compressed ratio indicates relative gold undervaluation.