






















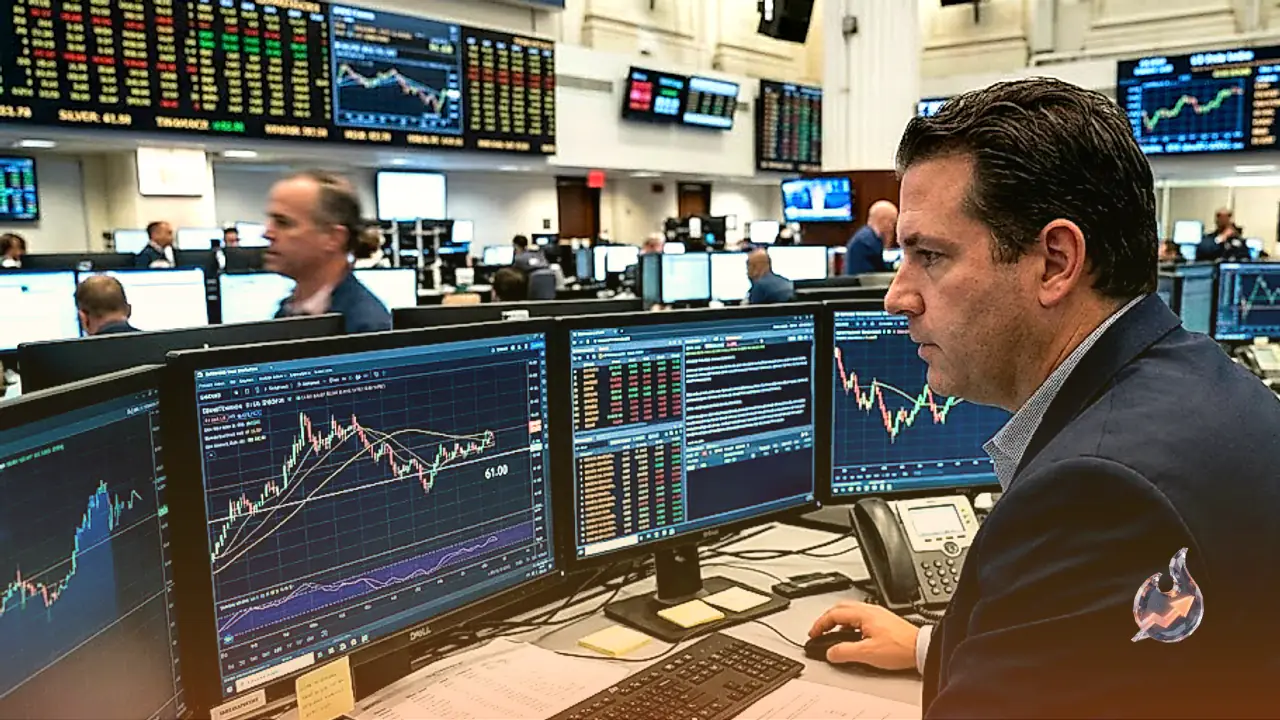

Silver prices managed to stage a recovery back toward the $61.00 per ounce threshold as the US Dollar lost some of its recent upward momentum. The slight corrective pullback in the greenback provided much-needed breathing room for non-yielding bullion assets, helping XAG/USD stabilize after a prolonged stretch of selling. Nonetheless, broad market sentiment remains cautious as signs of enduring resilience in the broader United States economy reinforce expectations of prolonged monetary tightness, keeping investors attentive ahead of the release of the Federal Open Market Committee (FOMC) September policy meeting minutes.
Economic Resilience and Hawkish Federal Reserve Expectations
Underpinning the underlying strength of the US Dollar are persistent signals that business activity across major sectors continues to hold up firmly. Strategists at Brown Brothers Harriman (BBH) have pointed out that recent business surveys continue to reinforce the Federal Reserve's tightening bias. Specifically, September purchasing managers' surveys from the Institute for Supply Management (ISM) pointed to steady expansion across manufacturing and service activities, while the prices paid components showed that inflationary pressures remain uncomfortably sticky.
This fundamental backdrop has directly shaped expectations across derivatives markets. According to BBH, Fed funds futures have continued to factor in a full 25 basis point rate hike in December, which would lift the benchmark policy range to 4.00-4.25%. Higher borrowing costs and firm yields generally raise the opportunity cost of holding non-yielding precious metals, limiting the scope for aggressive rallies in silver despite short-term dollar dips.
Technical Indicators and Near-Term Chart Levels
From a chart perspective, XAG/USD hovered around $61.21 during recent trade, exhibiting a prevailing bearish bias on the daily timeframe. Latest closing market data placed the metal at $61.69, marking a 1.35% increase from the prior close of $60.87 within an annual span of $45.85 to $121.30. Despite the bounce, the commodity remains capped beneath its 20-day exponential moving average (EMA) near $62.99 (with recent technical calculations placing the 20-day EMA at $62.90).
Momentum indicators such as the Relative Strength Index (RSI) at 42.27 (or 44 on a 14-period standard gauge) remain settled in mildly bearish territory. This positioning reflects ongoing distribution by sellers rather than an extremely oversold condition, meaning downside risks persist unless buyers force a definitive breakout above the $62.99 resistance ceiling. Key daily pivot points indicate immediate upside friction at $62.09 and $62.49, while downside support rests at $60.93 and $60.17.
Silver's Dual Character as a Store of Value and Inflation Hedge
Silver has sustained an enduring position as an actively traded commodity and investment vehicle, valued through history as a dependable store of wealth and medium of exchange. While gold frequently garners greater retail attention, market participants turn to silver to balance portfolio risk, leverage its intrinsic value, or shield wealth against persistent inflation. Exposure is typically acquired via physical bars and minted coins, or synthetically through exchange traded funds designed to reflect spot international bullion prices.
Valuation shifts in silver stem from an intricate balance of macroeconomic and physical variables. Rising geopolitical friction or fears of sharp economic contraction can activate safe-haven purchases, albeit generally with greater volatility than gold. Because silver pays neither yield nor dividend, its attractiveness generally climbs when prevailing interest rates decline. Moreover, with bullion priced primarily against the US Dollar (XAG/USD), a firm dollar tends to dampen buying power, whereas greenback weakness stimulates physical and speculative bids. Mining output and industrial recycling rates further influence market availability, given that silver is significantly more abundant in the earth's crust than gold.
Industrial Applications Across Global Manufacturing Hubs
Unlike pure monetary metals, silver derives a vast portion of its baseline consumption from practical industrial applications. It possesses the highest electrical conductivity of any commercial element, surpassing both copper and gold, making it vital in modern electronic circuits, solar photovoltaic cells, and advanced energy hardware. Spikes in industrial manufacturing directly lift consumption, while industrial slowdowns can leave physical stockpiles elevated.
Macroeconomic shifts across the world's largest commercial centres play a decisive role in directing price trends. Robust manufacturing operations in the United States and China consume substantial volumes of refined silver across multiple specialized production lines. Meanwhile, in India, retail and cultural demand for jewelry and decorative silverware serves as an influential pillar supporting global consumption patterns.
The Gold-Silver Ratio and Cross-Asset Dynamics
Precious metals traders often track silver's trajectory alongside gold, as safe-haven sentiment typically impacts both assets concurrently. To assess relative price fairness, analysts monitor the Gold/Silver ratio, which expresses the precise volume of silver ounces required to equal the price of a single ounce of gold. A historically elevated ratio is commonly interpreted as a sign that silver may be underpriced compared to gold, or that gold is trading at an extended premium, while a depressed ratio suggests the opposite dynamic.
Broader currency and commodity markets reflect similar macroeconomic crosscurrents. The AUD/USD pair edged lower in Asian trading, pausing a brief recovery from two-month troughs as persistent pressure on bond markets kept US Treasury yields around multi-year highs. Expectations of potential policy tightening from the Reserve Bank of Australia provided slight support for the Australian dollar. Concurrently, USD/JPY pushed back above 158.00 in early European dealings despite speculation surrounding the Bank of Japan, while spot gold advanced past $4,150 from its $4,100 floor as receding October Fed rate hike bets and dollar consolidation offered relief. European participants also watched budgetary tensions in France and geopolitical risks across the Middle East for further directional cues.