
























Gold faced renewed selling pressure during Wednesday's Asian trading session, slipping to a nearly four-week low and threatening to extend losses further below the $4,300 threshold. The precious metal is coming under intense pressure from a cocktail of fundamental headwinds, including a broadly stronger US Dollar, spiking global government bond yields, and growing expectations that the US Federal Reserve will raise interest rates at its upcoming September policy meeting.
Live market data shows spot gold trading around $4,348 following a 1.88% drop from its previous close of $4,431. Over the past 52 weeks, the metal has ranged between $3,486 and $5,586. Trading volume remains muted at 0.30 times its 20-day average, signaling cautious positioning among institutional traders ahead of crucial economic catalysts.
Surging Oil Prices and Escalating US-Iran Conflict
Geopolitical volatility in the Middle East reached a flashpoint following official confirmations from US Central Command that American forces carried out military strikes targeting Islamic Revolutionary Guard Corps facilities across southern Iran. Explosions were reported on Qeshm Island near the strategic Strait of Hormuz, throwing regional shipping and energy infrastructure into high alert.
The military engagement sent energy markets soaring. West Texas Intermediate (WTI) crude oil advanced for a third consecutive session, representing its fifth positive session in six days and reaching its highest valuation since July 24. Concurrently, US ultra-low sulfur diesel futures broke historic ground as the diesel crack spread over WTI crossed $100 per barrel for the first time, establishing an intraday record high above $102.00.
Federal Reserve Hawkish Shift and Treasury Yield Surge
The spike in crude oil and refined product prices has rekindled fears of a renewed inflationary wave across major economies. Investors increasingly expect central banks to respond aggressively to persistent price pressures. Remarks by Fed Chair Kevin Warsh at the Jackson Hole Symposium last Friday have reinforced market pricing for a September rate hike.
Compounding the pressure on precious metals is a severe global bond market sell-off driven by expanding fiscal deficits. The yield on the benchmark 10-year US Treasury note climbed to its highest point since January 2025. Because gold pays no yield, rising real interest rates significantly increase the opportunity cost of holding bullion, directing capital flows away from non-yielding commodities and toward the US Dollar and high-yielding government debt.
Technical Indicators Point to Fading Bullish Momentum
From a technical standpoint, gold's market structure reflects deepening bearish sentiment. An intraday breakdown below the 50% Fibonacci retracement level of the recovery initiated from the year-to-date low touched in July has emboldened short-sellers. The Moving Average Convergence Divergence (MACD) indicator remains deeply in negative territory below the zero line. Live technical readings show MACD at 79.29 against a signal line of 97.66 (histogram at -18.37), confirming downside momentum.
The Relative Strength Index (RSI) hovers near 44 (live RSI at 47), illustrating a distinct lack of buying power, while the Stochastic oscillator displays a fast line reading of 9 against a signal line of 29. Technical analysts emphasize that sustained price action below the 200-day Exponential Moving Average (EMA) near $4,276 would open the door for a retest of lower support zones. Pivot analysis sets key intraday levels with a pivot point at $4,360, immediate support S1 at $4,317, S2 at $4,287, and upside resistance at R1 $4,390 and R2 $4,433.
Dollar Dominance Weighs Heavily on Major Forex Pairs
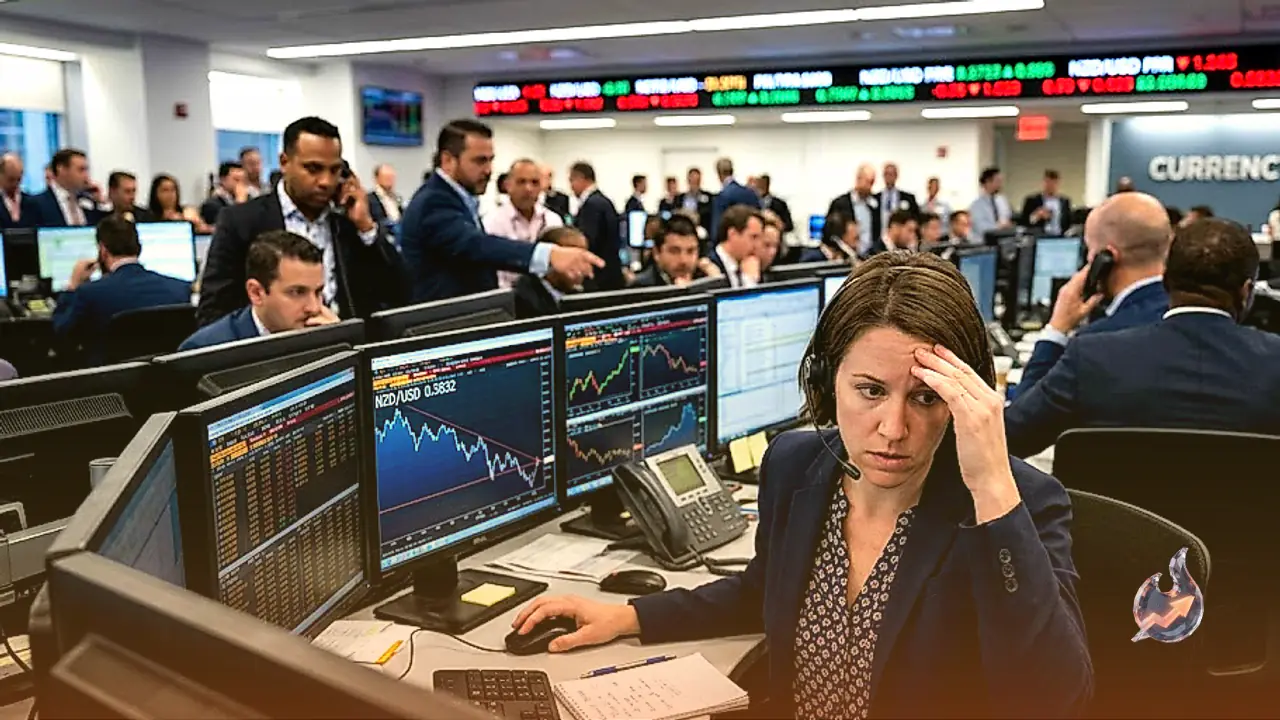
The US Dollar accelerated its broad rally across foreign exchange markets, drawing support from rising yields and safe-haven flows. Currency heat maps highlight the Greenback's strongest gains coming against the New Zealand Dollar, while major currency pairs experienced notable downward corrections.
EUR/USD extended its downside slide, breaching the key 1.1600 support handle despite lower-than-expected US macroeconomic data releases. Similarly, GBP/USD stumbled back to the low 1.3500 region, marking a fresh two-week trough. The pervasive strength of the US Dollar across FX pairs underscores the challenging backdrop for dollar-denominated bullion.
Focus Shifts to Friday's Crucial US Non-Farm Payrolls Report
Traders and market participants are maintaining a sharp focus on the upcoming US Non-Farm Payrolls (NFP) report scheduled for release on Friday. The labor market data will provide vital guidance regarding the health of the American economy and could cement expectations for Federal Reserve policy tightening in September. A robust employment print would likely bolster the US Dollar further, keeping gold locked in a defensive posture.