
























A sweeping wave of selling gripped the US Dollar across international currency markets following the first results of the US midterm elections. The Swiss Franc capitalized heavily on this political realignment, forcing USD/CHF down to an eight-week trough of 0.8127 before staging a modest rebound toward 0.8159 and the live reading of 0.8160. Even with this slight European session bounce, the pair remains more than 0.5% lower on the daily chart, while live data marks a 0.29% decline from its previous close of 0.8184. The combination of legislative uncertainty and deteriorated chart patterns continues to leave the Greenback fundamentally vulnerable against safe-haven peers.
Midterm Upset Sends the Greenback Tumbling Across Asset Classes
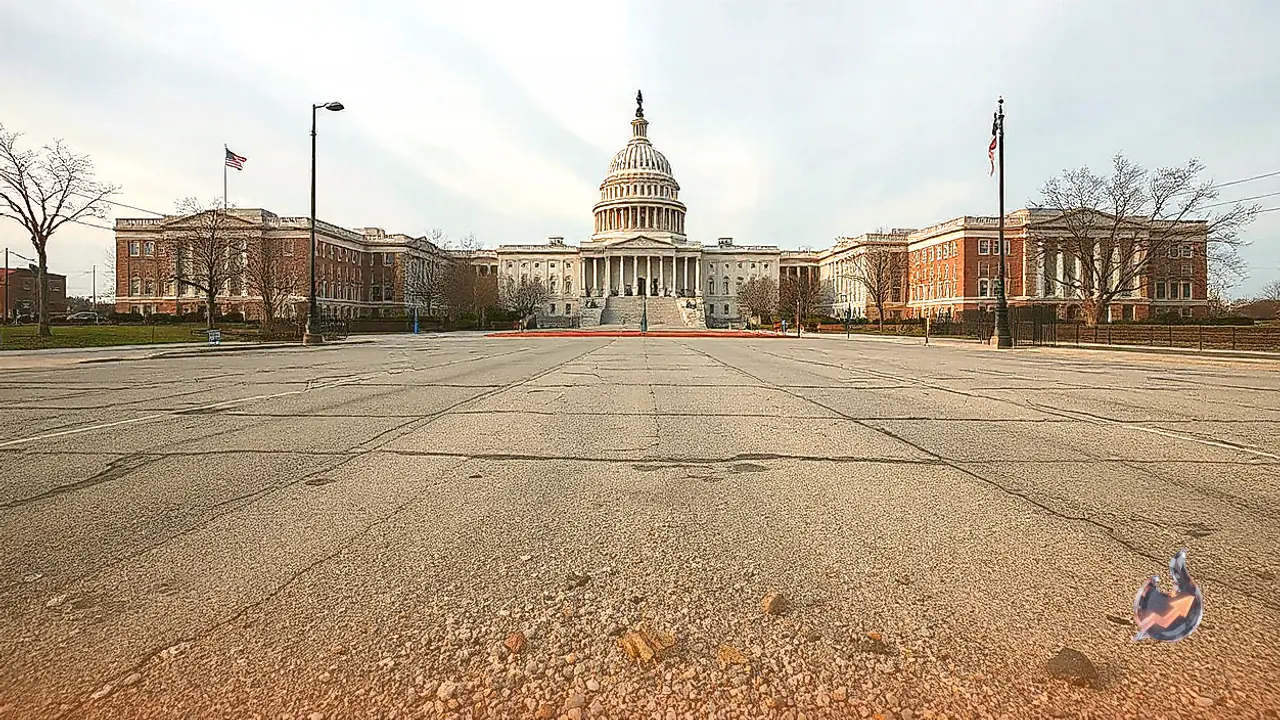
Voters delivered a decisive verdict on the policies of President Donald Trump during the midterm elections, enabling the Democratic Party to capture control of both the House of Representatives and the Senate. In a notable geographic shift, Democrats flipped traditionally staunch Republican territories, securing victories in Kansas, North Carolina, and Texas. The prospect of a divided government in Washington immediately triggered a broad retreat from dollar-denominated assets during Wednesday's trading session.
Whenever political friction threatens to impede legislative agendas in the United States, foreign exchange capital consistently gravitates toward traditional preservation assets. The Swiss Franc established itself as the strongest performer against the US Dollar among major global currencies on the currency heat map. Heightened aversion to Washington's looming political deadlock fueled direct inflows into the Swiss currency, reversing earlier quarterly momentum built by the Greenback.
ING Analysis: Relief Window May Close as Shutdown Risks Loom
Market strategists have noted that the dollar's ability to pull back from session lows reflects timing rather than renewed institutional conviction. Chris Turner of ING explained that the greenback's modest rebound probably owes to the fact that the Democrats do not take office until January, alongside the stabilising factor that President Donald Trump accepted the election results, which prevented disorderly panic selling immediately after the vote counts.
However, Turner sounded a cautionary note regarding the medium-term economic horizon, emphasising that a Democratic-controlled Congress would remain a mild negative factor for the dollar. He pointed to two primary overhangs: potential friction surrounding policy developments in artificial intelligence, and the heightened probability of an extended US government shutdown beginning as early as next summer. These structural governance conflicts threaten to keep upside momentum in check over the coming quarters.
Technical Structure: Confirmed Double Top Targets 0.8050 Trough
From a chartist perspective, USD/CHF continues to trade firmly inside a descending channel. Tuesday's sharp rejection at the 0.8220 threshold validated a classic Double Top pattern established around the 0.8380 peak. This technical development has handed active control back to short sellers, setting up a defined bearish pathway across short-term horizons.
Momentum indicators plotted on four-hour timeframes reinforce this downside bias. The 14-period Relative Strength Index remains depressed below the 40 mark, hovering above oversold territory and indicating that upward price velocity is essentially non-existent. Simultaneously, the Moving Average Convergence Divergence indicator registers fractionally negative, demonstrating that corrective bounces lack volume and institutional backing.
While initial dip-buying has cushioned the decline near 0.8130, the measured objective derived from the double top formation aligns with early September swing lows positioned between 0.8050 and 0.8070. Conversely, buyers hoping to negate this structural breakdown must engineer a sustained break above the double top neckline at 0.8220. Only a clear push past that barrier would redirect chart focus toward early November resistance around 0.8250, followed by the October 28 peak recorded at 0.8313.
Live Technical Indicators and Critical Boundaries
Live trading parameters highlight the broader technical landscape for USD/CHF. Over the trailing 52-week cycle, the exchange rate has fluctuated between 0.7629 and 0.8395, with current trading activity registering volume at exactly 1.00 times its 20-day average. In terms of trend averages, the 20-day exponential moving average sits at 0.8246, the 50-day EMA resides at 0.8220, and the 200-day EMA stands at 0.8057. On the simple moving average front, the 50-day SMA is calculated at 0.8223, while the 200-day SMA rests at 0.7997.
Despite the existence of a long-term golden cross where moving averages reflect an extended primary uptrend, spot price has dropped beneath the lower boundary of the 20-day Bollinger Band (0.8169 to 0.8362, with a middle band at 0.8266). Volatility gauges place the 14-day Average True Range at 0.01, establishing a baseline cushion for setting trade invalidation orders. The intraday pivot sits at 0.8166, bracketed by resistance marks at 0.8205 (R1) and 0.8250 (R2), and floor supports at 0.8121 (S1) and 0.8082 (S2). The trend strength metric ADX reads 19, signaling an indecisive range-bound condition, alongside Stochastic readings of 18 on the fast line and 22 on the signal line.
Cross-Market Impact: Yen Advances, Gold Clears 4,000 Mark
The reverberations of the US midterm vote echoed through multiple global asset classes. The US Dollar Index, tracking the currency against a basket of six competitors, fell sharply during Asian market hours to its lowest standing since late September as institutional players rebalanced portfolios against potential gridlock in Washington.
In Asian currency trade, USD/JPY tumbled below the 158.00 psychological threshold, touching a one-month low. As election tallies confirmed Democratic dominance in both congressional chambers, falling US Treasury yields undercut policy expectations for further interest rate hikes by the Federal Reserve, sparking rapid unwinding of dollar-yen long positions.
The Australian Dollar managed to stabilize near 0.6965, holding above a two-week low as broader dollar weakness counterbalanced domestic headwinds. However, a less hawkish stance from the Reserve Bank of Australia prevented AUD/USD from mounting an aggressive rally.
Precious metals experienced substantial inflows as safe-haven sentiment escalated. Gold capitalized on retreating Treasury yields and dollar softness, maintaining firm gains well above the major psychological benchmark of $4,000 per ounce during the European morning session. With governance uncertainties taking center stage in the United States, defensive allocation patterns continue to dictate international market sentiment.