
























Silver prices pulled back as the US Dollar posted gains following the release of the latest US Personal Consumption Expenditures (PCE) inflation metrics. While spot Silver continues to trade above its 50-day SMA, key overhead technical hurdles including the 100-day and 200-day simple moving averages continue to limit buyer momentum. Silver was trading down 0.99% at $67.96 per troy ounce compared to the previous close of $68.64, with volume surging to 19.47 times its 20-day average amid intense technical interaction around key moving averages.
US PCE Inflation Hotter Than Expected as Dollar Index Rebounds
Data published by the US Bureau of Economic Analysis revealed that the headline PCE Price Index rose 0.2% month-over-month (MoM) in July, topping the 0.1% consensus forecast. On an annual basis, headline PCE inflation came in at 3.7%, exceeding expectations of 3.6%. Meanwhile, core PCE inflation, which excludes volatile food and energy components, registered a 0.2% MoM increase and a 3.3% year-over-year (YoY) rise, exactly matching market forecasts.
The slight upside surprise in headline inflation provided immediate support to the US Dollar following its recent consolidation. The US Dollar Index (DXY), which measures the Greenback against a basket of six major currencies, climbed nearly 0.30% to trade near 99.20. Because Silver (XAG/USD) is priced in US Dollars on international markets, a firmer Greenback increases the relative cost for foreign investors, weighing on non-yielding metals.
Technical Structure for Silver (XAG/USD) and Key Price Levels
On the daily chart, XAG/USD is holding above its short-term trend support marked by the 50-day SMA ($61.71) and 50-day EMA ($64.48). However, price action remains constrained beneath the 100-day SMA ($68.31) and 200-day SMA ($71.36 / $72.31). This alignment signals a neutral-to-bullish near-term bias, indicating that buyers are attempting to build a solid base above short-term support while encountering a dense zone of overhead supply.
Oscillators reflect positive momentum without pointing to overbought conditions. The 14-day Relative Strength Index (RSI) stands at 62. The Moving Average Convergence Divergence (MACD) line rests at 2.03 above the signal line of 1.51 (histogram at 0.52), maintaining a bullish structure though buyers have yet to gather sufficient volume to break nearby resistance barriers.
Immediate overhead resistance is situated at the 38.2% Fibonacci retracement level of $68.02, closely followed by the 100-day SMA at $68.31. A decisive breakout above this zone would focus attention on the 50.0% Fibonacci retracement at $72.10 and the 200-day SMA at $72.31. Further targets lie at the 61.8% retracement level of $76.18 and the 78.6% retracement level of $81.98. On the downside, immediate daily pivot support sits at $68.40, with primary support at S1 ($67.04) and S2 ($66.13). The 52-week trading range spans between $38.53 and $121.30.
Industrial Fundamentals and Investment Demand Dynamics
Silver occupies a unique position in global commodities as both a monetary metal and an indispensable industrial input. Possessing the highest electrical conductivity of all metals, outperforming copper and gold, Silver is vital for electronics manufacturing and solar energy production.
Industrial activity in major economies such as the United States and China directly drives physical Silver consumption. Furthermore, consumer demand for Silver jewelry in India plays a critical role in global demand balance. During periods of macroeconomic uncertainty or geopolitical friction, investors also turn to Silver as a safe-haven asset, although to a somewhat lesser extent than Gold. As a non-yielding instrument, Silver generally benefits from lower real interest rates.
The Gold-Silver Ratio and Relative Valuation
Silver historical price movements show a strong positive correlation with Gold. When Gold advances, Silver typically follows suit due to their shared status as store-of-value assets. Traders frequently monitor the Gold/Silver ratio, which measures how many ounces of Silver are needed to purchase one ounce of Gold, to evaluate relative pricing.
A historically elevated Gold/Silver ratio is often interpreted by market participants as an indication that Silver is undervalued relative to Gold, or that Gold is overextended. Conversely, a low ratio may suggest that Gold is relatively undervalued compared to Silver.
Broader Financial Market Developments
The movement in Silver unfolded alongside significant volatility across international financial markets
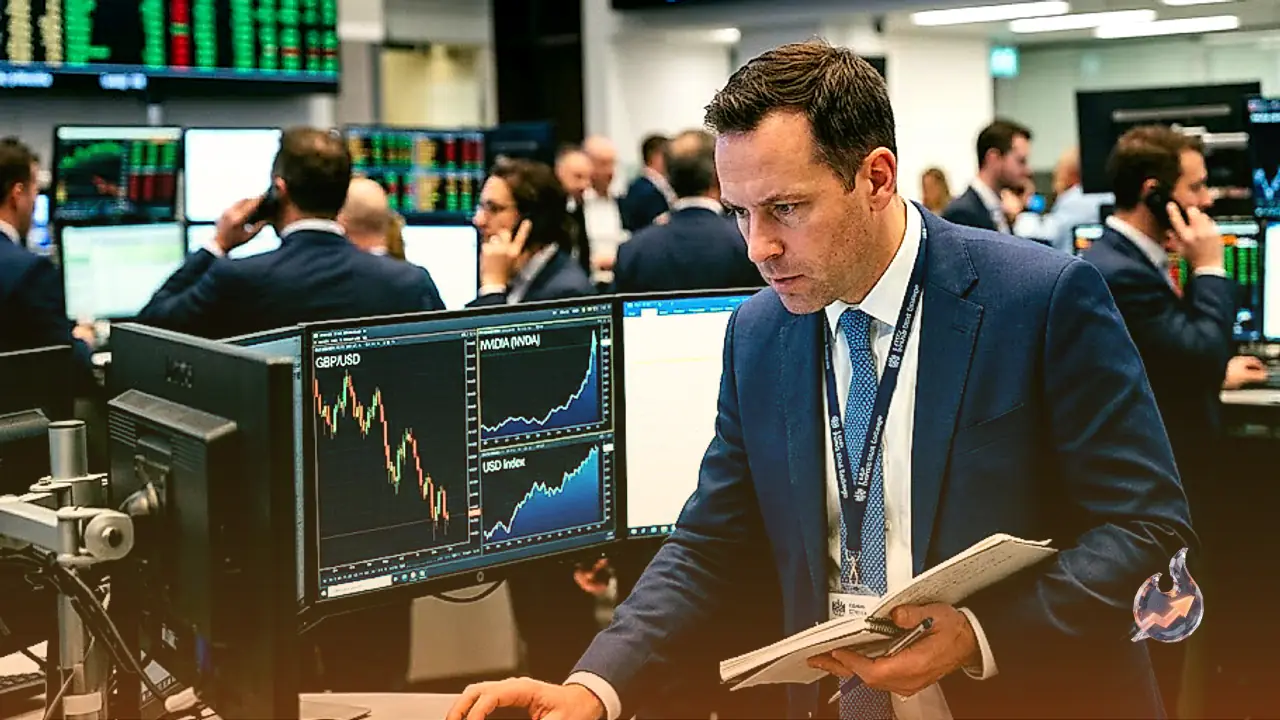
- Foreign Exchange: GBP/USD resumed its decline, pulling back below the 1.3600 handle. EUR/USD similarly receded toward multi-day lows near 1.1650 under pressure from the stronger US Dollar.
- Gold Bullion: Gold experienced selling pressure, dropping from near $4,700 toward the $4,600 per troy ounce mark as US Treasury yields rebounded.
- Cryptocurrency: Bitcoin traded above $78,000 while attempting to clear resistance near $80,000. Institutional backing remained solid, with BlackRock's tax-deferred Bitcoin-to-ETF swap volume hitting $5 billion.
- Tech Earnings: AI technology provider Nvidia is scheduled to release its quarterly earnings report after market close, with revenue expected to exceed $92 billion and earnings per share projected at $2.09.
- Federal Reserve Policy: Kevin Warsh is preparing to deliver his inaugural Jackson Hole address as Federal Reserve Chair this Friday, with market participants analyzing potential guidance ahead of the September interest rate decision.