























Gold is nursing its wounds this week, drifting close to two-week lows in Friday's Asian session as sellers stay hopeful of locking in the metal's biggest weekly loss in six weeks. Early in the day the metal staged a shallow bounce toward $4,000, but the recovery looks unconvincing and the market is treating it as little more than a dead cat bounce before the next leg down.
According to live market data, gold is currently changing hands near $3,991, a slim 0.14% above the previous close of $3,986. Over the past year it has ranged between $3,264 and $5,586, and turnover in this session ran at roughly 11 times the 20-day average, a sign there is real conviction behind the slide.
A dollar comeback is squeezing gold
The US Dollar is holding on to its recovery, and that is the single biggest weight on gold right now. Fresh tension in the Middle East has fanned inflation risks and revived bets that the Federal Reserve could raise interest rates. Because gold pays no yield, a firmer dollar and rising rate expectations pull money out of the metal and back toward the greenback, which is exactly the dynamic playing out this week.
The Middle East on a knife's edge
The United States has intensified its military strikes on several targets inside Iran and also opened fire on a tanker heading toward Kharg Island, Iran's largest oil export terminal. Iran hit back with missiles and drones aimed at US allies in the region. On top of that, Tehran told its sponsored militant group in Yemen, the Houthis, to be ready to close the oil route through the Red Sea if Washington were to target Iranian energy infrastructure.
Ordinarily this kind of geopolitical instability lifts gold as a safe haven, but this time the strength of the dollar and the fear of higher rates are overpowering that pull, leaving the metal grinding lower.
What the Fed is signaling
In their latest speeches, several Fed officials openly argued for rate hikes, citing the renewed outbreak of hostilities in the Middle East. That backing helped the dollar rebound at the expense of the non-yielding gold price.
Fed's Jefferson struck a moderately firm tone. On a speech-scoring gauge his remarks rated 6 out of 10, slightly above the 5.8 out of 10 historical average, meaning his message came across as just marginally more resolute than the established baseline. His emphasis that the "current policy stance should support job market, allow inflation to resume decline toward 2%", paired with a warning that a failure of inflation to cool would warrant reconsidering the stance, underscores a conditional hawkishness anchored in data dependence and the tension of the dual mandate amid overlapping energy, tariff, and AI shocks.
A sentiment index that tracks the Fed's stance was unchanged, moving 0.00 points to a still-elevated 126.57. That confirms the speech left overall Fed pricing firmly in hawkish territory, even without any incremental shift.
The data that could move gold next
Looking ahead, traders are waiting on the University of Michigan's preliminary Consumer Sentiment and Inflation Expectations readings for fresh trading cues in gold, while continuing to watch geopolitical developments in the Middle East against a backdrop of bearish technicals.
End-of-week flows and profit-taking are also likely to stay in play, with gold lingering close to the year-to-date low of $3,942 it touched a week ago.
The chart: below every major average
On the daily chart, XAU/USD trades at $3,997.14, holding clearly below the 21-day simple moving average (SMA) at $4,076.42 and the 50-day SMA at $4,291.26, which keeps the near-term bias bearish and the metal under firm downside pressure. The longer-term 100-day and 200-day SMAs, at $4,535.75 and $4,495.43 respectively, remain stacked well above spot, reinforcing the capped tone. On live figures the 14-period Relative Strength Index sits near 38 (it was hovering around 39 on the chart), pointing to weak but not oversold momentum, hinting that sellers still hold control with room for further downside before exhaustion.
On the topside, immediate resistance emerges at the 21-day SMA at $4,076.42, with a break higher exposing the 50-day SMA at $4,291.26 as the next barrier. Above there, the 200-day SMA at $4,495.43 and the 100-day SMA at $4,535.75 form a dense medium-term resistance band that would need to be reclaimed to ease the broader bearish tone. With no nearby moving-average supports below the market, any fresh lows would leave price hunting for a new structural floor. In the near term the technicals point to a possible test of the falling trendline support near $3,850, and as long as $4,076.42 stays unbroken, the risks remain skewed toward continued downside.
Stock sell-off and a softer inflation print
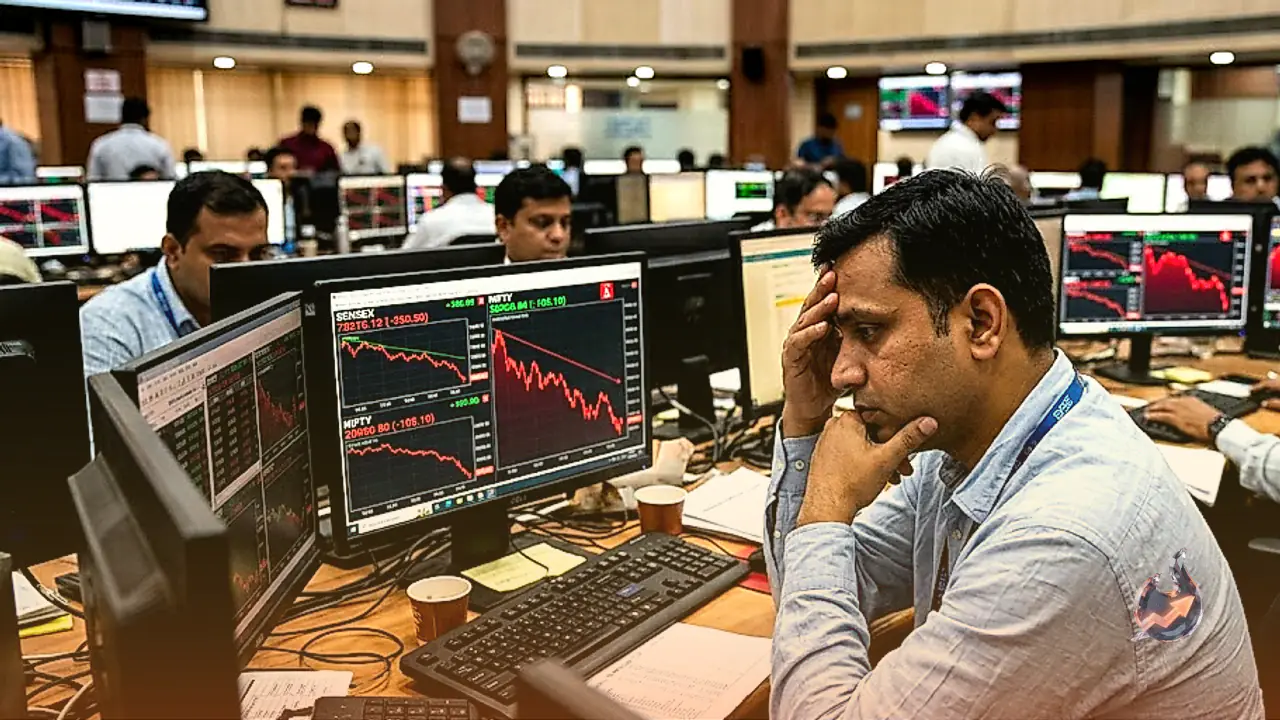
Asian stock markets faced a sharp sell-off on the last trading day of the week, tracking negative cues from US equity markets. US technology stocks fell sharply on Thursday, with shares of sophisticated chipmakers extending their losses.
On inflation, the June CPI fell 0.4% on the month, the largest one-month decline since April 2020. That dragged the annual rate down to 3.5% from May's 4.2% and snapped a three-month acceleration streak. Core prices went nowhere, flat on the month and easing to 2.6% year-on-year, both under consensus.
Why gold matters as a safe haven
Gold has played a key role through human history, widely used as a store of value and a medium of exchange. Today, beyond its shine and its use in jewelry, the precious metal is broadly seen as a safe-haven asset, considered a sound investment during turbulent times. It is also viewed as a hedge against inflation and against depreciating currencies, since it does not rely on any specific issuer or government.
Central banks keep hoarding gold
Central banks are the biggest gold holders. In their effort to support their currencies during turbulent times, they tend to diversify their reserves and buy gold to shore up the perceived strength of the economy and the currency. High gold reserves can be a source of trust in a country's solvency. Central banks added 1,136 tonnes of gold worth around $70 billion to their reserves in 2022, according to the World Gold Council, the highest yearly purchase since records began. Central banks from emerging economies such as China, India and Turkey are quickly building up their gold reserves.
How the dollar steers gold
Gold has an inverse correlation with the US Dollar and US Treasuries, both major reserve and safe-haven assets. When the dollar weakens, gold tends to rise, letting investors and central banks diversify in turbulent times. Gold is also inversely correlated with risk assets: a rally in stocks tends to weigh on gold, while sell-offs in riskier markets tend to favor the metal.
The price can move on a wide range of factors. Geopolitical instability or fears of a deep recession can send gold sharply higher thanks to its safe-haven status. As a yield-less asset, gold tends to rise when interest rates fall, while a higher cost of money usually drags on it. Even so, most moves hinge on how the dollar behaves, since the metal is priced in dollars (XAU/USD). A strong dollar keeps gold in check, whereas a weaker dollar tends to push it up, and this week it is precisely that dollar strength doing the damage.