























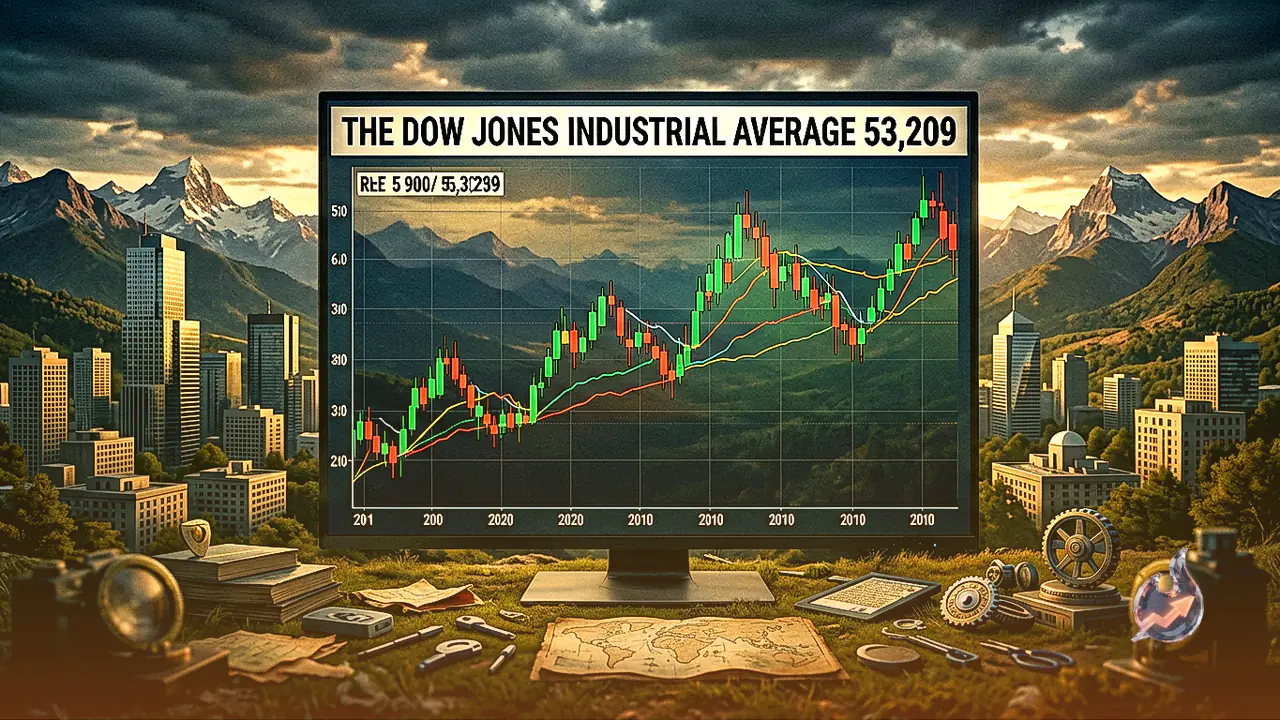

The Dow Jones Industrial Average finds itself navigating a complex intersection of macroeconomic shifts, energy market dynamics, and structural index limitations. Trading near the 53,209 mark, the index sits roughly 300 points lower, down about 0.67 percent from its previous close of 53,569. With a 52-week range spanning between $44,948 and $54,744 and volume running at 0.33x of its 20-day average, the index arithmetic continues to work against broader geopolitical developments.
Price Weighting and the Energy Sector Disconnect
The structural composition of the index heavily dictates how it reacts to external supply shocks and geopolitical events. Following the removal of ExxonMobil in 2020, Chevron (CVX) remains the sole energy representative in the benchmark, accounting for a mere 2.2 percent of the total index weight. Conversely, financial institutions make up over a quarter of the index across five companies, with Goldman Sachs (GS) alone commanding an 11.5 percent share due to a share price exceeding $1,000. This disparity means that when supply disruptions lift energy commodities, the index receives barely two points of benefit while holding more than twelve times that weight in sectors vulnerable to interest rate hikes. Furthermore, the inclusion of Alphabet (GOOGL) at the end of June stripped out the last remaining telecom ballast, replacing it with a duration-sensitive asset.
Interest Rate Projections and Economic Releases
Shifting expectations regarding Federal Reserve monetary policy have heavily influenced near-term market direction. Rate futures indicate that pricing for a September rate increase has climbed to roughly 60 percent, up sharply from 35 percent prior to recent commentary. Such a move would push the target range to 3.75 percent to 4.00 percent, reversing models built over the previous two years. Attention now shifts to a series of critical data releases, starting with the Institute for Supply Management manufacturing Purchasing Managers Index with the prices paid component forecast at 72. Additional reports, including the private payroll estimate, the Beige Book, and subsequent services PMI readings, will provide further clarity ahead of the September 16 policy decision.
Technical Levels and Market Momentum
On the technical front, the 53,500 handle has turned into a formidable resistance ceiling, capping previous weekly gains. Immediate session support rests in the 53,100 area, with the 53,000 level serving as the next safety shelf. Below that, the rising 50-day Exponential Moving Average near 52,700 underpins the broader August advance. Computed technical metrics show the 14-day RSI sitting at a neutral 50, while the MACD indicator reads 189.87 against a signal line of 272.30, resulting in a bearish histogram reading of -82.44. Bollinger Bands place current price action safely within the $52,881 to $54,337 boundaries, with the Average True Range (ATR) at 455.58 indicating moderate daily volatility.
Index Background and Trading Instruments
Established as one of the oldest stock market barometers, the Dow Jones Industrial Average tracks 30 prominent US corporations using a price-weighted methodology rather than capitalization weighting. Calculated by summing component prices and dividing by a divisor currently set at 0.152, the index was founded by Charles Dow. Market participants utilize several vehicles to gain exposure to the DJIA, ranging from exchange-traded funds like the SPDR Dow Jones Industrial Average ETF (DIA) to futures and options contracts. Meanwhile, broader markets show currency pairs like GBP/USD hovering near 1.3550 and EUR/USD testing the 1.1600 barrier, while commodities such as gold pull back below $4,400 per troy ounce and cryptocurrency assets like Bitcoin maintain resilience above $78,000.