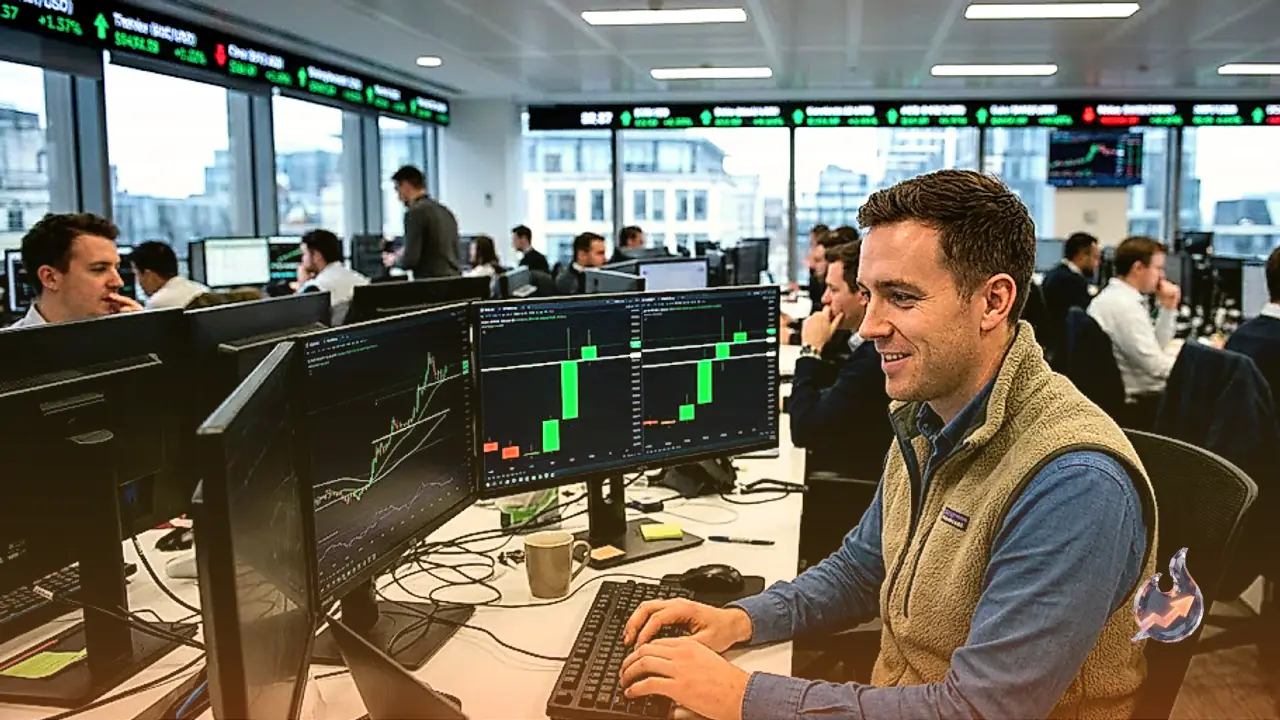

























Major alternative cryptocurrencies are showing renewed upward traction as institutional capital and large-scale holders step up accumulation. Friday trading saw broad stabilization and positive technical setups across key assets following solid mid-week recoveries. Ripple edged above $1.54 after posting a 2% rebound the prior day, while Cardano held firm around $0.2500 as it tested an ascending channel breakout alongside a critical retracement mark. Simultaneously, Solana traded in the vicinity of $118, sustaining upward momentum following the bullish flag breakout initiated in the prior week.
Institutional ETF Demand Provides Solid Underpinning
The positive price movement is receiving direct backing from institutional vehicle inflows. Exchange-traded funds dedicated to Ripple and Solana recorded notable capital additions on Thursday. Ripple-focused funds absorbed $14.89 million, marking three consecutive sessions of net inflows. Meanwhile, Solana funds attracted $32.81 million, extending their streak of uninterrupted daily inflows to five sessions. Steady institutional demand through structured financial products highlights growing long-term confidence in altcoins beyond the leading digital assets, providing reliable liquidity to support broader market expansion.
Cardano Sees Heavy Whale Accumulation and Supply Shifts
On-chain dynamics for Cardano reveal substantial accumulation by dominant network participants. According to data from Santiment, the proportion of total ADA supply currently in profit rose sharply from 16.88% to 30.22% over the past two weeks. Alongside rising profitability, large wallets holding between 100 million and 1 billion ADA tokens expanded their collective footprint, now controlling 7.59% of the circulating supply compared to 6.5% two weeks earlier. This sustained accumulation by whale entities suggests that significant inventory is moving into firm hands, reducing immediate selling pressure across spot order books.
Ripple Technical Structure Points to Intact Uptrend
Ripple traded above $1.55 during Friday sessions, preserving a favorable technical bias over the near term. On the four-hour timeframe, the cross-border remittance asset trades comfortably above its 50-, 100-, and 200-period Exponential Moving Averages (EMAs). These moving averages are fanning out positively, signaling an intact upward trend structure. Momentum indicators offer constructive confirmation: the Relative Strength Index (RSI) sits just below 60, while the Moving Average Convergence Divergence (MACD) lingers marginally beneath the zero line, suggesting that recent price gains are consolidating rather than facing trend reversal. On the downside, initial weakness would be confirmed by a drop below the 78.6% Fibonacci retracement at $1.5137, with secondary support established at the 50-period EMA near $1.4695.
Solana Bullish Flag Extension and Live Market Backdrop
Solana maintained levels around $118 on Friday, building on a roughly 2% bounce from the previous session. The price remains positioned well above key moving averages, with the 50-, 100-, and 200-day EMAs positioned at $99.27, $92.22, and $93.93, respectively, maintaining a distinctly constructive backdrop. From a chart pattern standpoint, Solana is extending its bullish flag breakout that began with a 10% advance on September 18. To sustain this trajectory toward the January 6 peak of $148.74, the price must decisively clear the December 18 low at $116.88.
Live market data shows Solana trading at $116.35, marking a 1.20% rise from the previous close of $114.98. Over the past 52 weeks, the token has fluctuated between $60.41 and $145.38, with current volume tracking at 1.13 times the 20-day average. Technical indicators show a 14-day RSI of 65 and a MACD reading of 5.45 against a signal line of 4.50, generating a positive histogram of 0.95. Moving averages show the 20-day EMA at $107.46, 50-day EMA at $98.44, and 200-day EMA at $95.59, with the 50-day crossing above the 200-day to confirm a golden cross. Bollinger Bands span from $92.47 to $119.88, while the 14-day ADX sits at 45, reflecting strong trend strength. Key live price thresholds place the pivot at $117.00, with overhead resistance at R1 $117.65 and R2 $118.96, and downside support at S1 $115.70 and S2 $115.04. Broader downward protection rests near the $100 psychological level, reinforced by the 50-day EMA at $99.21.
Cardano Resistance Boundaries and Extended Targets
Cardano faces a critical resistance cluster near current levels. A confirmed breakout above this hurdle would establish an initial target at the $0.3136 swing high, with potential expansion toward the 1.272 Fibonacci extension level at $0.3916. Technical momentum indicators align with this positive scenario: the RSI trades near 65 while the MACD remains in positive territory with a rising histogram, indicating that buyers maintain overall control despite near-overbought conditions. If downward pressure emerges, immediate floor support lies at the 200-day EMA of $0.2420 and the March 29 low at $0.2328, safeguarding the 50% retracement level at $0.2841, with deeper support at the 50- and 100-day EMAs at $0.2106 and $0.2066.