
























A sharp advance in traditional sovereign debt returns alongside renewed momentum in the American currency has interrupted the upward trajectory of major digital assets. Bitcoin faced notable selling resistance, oscillating around the $86,000 threshold following aggressive profit realization among market participants. After touching a recent peak near $87,000, the digital asset transitioned into an orderly consolidation phase as institutional allocations exhibited conflicting trajectories.
Macro Hurdles: Treasury Yields and Greenback Surge
Sovereign debt markets have introduced significant resistance for speculative asset classes. The 10-year US Treasury yield extended its upward march to record an intraday multi-decade high near 5.35% on Monday before settling around 5.28%. Elevated yields on sovereign debt enhance the appeal of risk-free government obligations, prompting capital allocators to reassess their exposure to volatile instruments like cryptocurrencies.
Simultaneously, the US Dollar Index (DXY) climbed to an intraday peak of 102.53 on Monday, achieving levels unseen since early April 2025. A strengthening dollar routinely exerts downward pressure on dollar-denominated assets. Combined with persistent inflation concerns across major economies, overall market sentiment remains cautious, requiring substantial organic demand before any broad-based recovery can materialize.
Institutional ETF Outflows Versus Corporate Accumulation
Institutional participation presented contrasting dynamics at the start of the week. US-listed spot exchange-traded funds posted an aggregate net outflow of $89.90 million on Monday, reflecting tactical de-risking among passive capital vehicles. In contrast, corporate balance sheet expansion continued at Strategy (MSTR), which augmented its holdings by acquiring 334 BTC, signaling enduring long-term corporate appetite despite immediate market turbulence.
On-chain analytics from Santiment reveal that short-term distribution has been the primary catalyst for the current pullback. The Network Realized Profit/Loss (NPL) metric jumped sharply on Monday to its highest reading since November 23, 2025. This pronounced spike indicates that existing holders have been systematically offloading holdings at substantial markups, creating an influx of supply that capped near-term upward momentum.
Comprehensive Technical Framework and Moving Averages
Live trading figures show Bitcoin trading near $86,122, up 0.39% from the previous close of $85,787, within a 52-week envelope spanning $57,748 to $90,439. Volume stands at 0.82 times its 20-day moving average. The 14-period Relative Strength Index (RSI) registers at 66, maintaining a positive reading while remaining comfortably shy of formal overbought limits. The trend strength metric ADX(14) holds at 44, reflecting an established directional environment.
The Moving Average Convergence Divergence indicator prints at 1982.66 against a signal line of 2045.35, generating a histogram reading of -62.69 that captures minor negative momentum. The fast Stochastic line resides at 76 alongside a signal line at 77. Daily volatility, measured by the 14-day Average True Range (ATR), stands at $2073.40, offering a concrete volatility benchmark for defensive order placement. Bollinger Bands encompass a range between $79,155 and $88,575 around a $83,865 midpoint, keeping price comfortably within standard deviations.
Crucial Support Floors and Resistance Ceilings
The medium-to-long-term trend remains fundamentally upward, bolstered by an array of rising moving averages below current price levels. The 20-day Exponential Moving Average (EMA) sits at $83,562, followed by the 50-day EMA at $79,418 and the 200-day EMA at $75,637. Simple moving averages confirm this posture, with the 50-day SMA at $79,919 and the 200-day SMA at $71,659, confirming a golden cross structure where shorter-term moving averages float cleanly above long-term lines.
Immediate intraday pivot points delineate key reaction levels: the primary pivot sits at $85,789, with overhead resistance levels mapped at R1 $86,445 and R2 $86,768. On downward slides, initial support rests at S1 $85,466, followed by S2 $84,811. Beyond immediate intraday levels, horizontal structural support lies at $85,000, before the 50-day EMA at $79,430 provides a secondary buffer. Deeper technical cushions emerge at the 100-day EMA of $75,565 and the 200-day EMA of $75,056, preceding horizontal liquidity zones down at $66,500 and $62,300.
Digital Currency Structure and Market Capitalization Metrics
Bitcoin functions as the primary decentralised cryptocurrency by valuation, conceived as digital tender operating outside central oversight and removing intermediaries from value transfer. Alternative digital assets, commonly grouped as altcoins, trace their evolutionary lineage back to Bitcoin protocol forks or divergent smart contract ecosystems. Historical examples like Litecoin emerged directly as modified offshoots of Bitcoin code.
Stablecoins operate concurrently as monetary anchors, maintaining fixed valuation against fiat currencies like the US dollar through reserve backing or algorithmic mechanisms to provide essential trading liquidity. Bitcoin dominance, measuring Bitcoin's market capitalization as a percentage of the entire digital asset space, serves as a crucial barometer of risk appetite. High dominance generally marks phases where investors favor established capital preservation, whereas falling dominance indicates capital reallocation into higher-beta altcoins.
Regulatory Initiatives and Broader Altcoin Performance
On the policy landscape, Commodity Futures Trading Commission Chairman Michael Selig stated that the regulator will advance unilateral crypto oversight frameworks in the wake of congressional deadlock regarding broader statutory regimes for digital assets. This regulatory push highlights evolving compliance expectations across spot and derivatives venues.
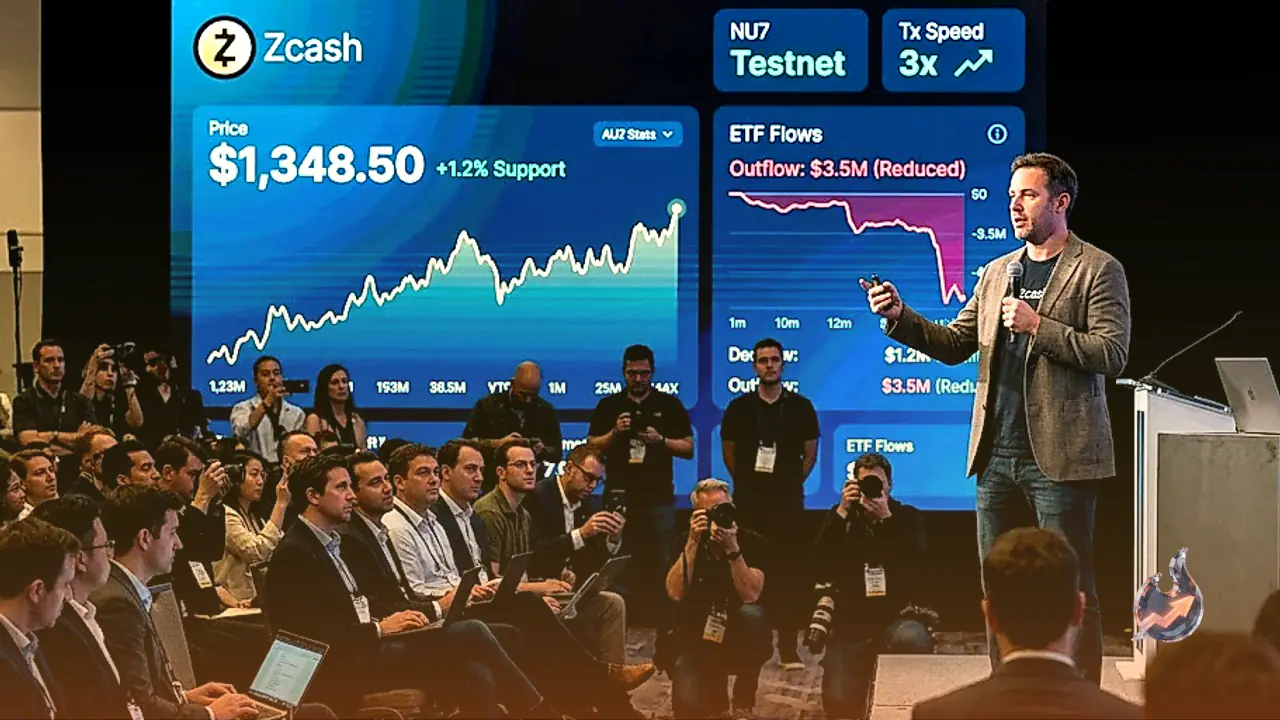
Among individual altcoins, Ripple trades defensively below $1.499 while Stellar remains pressured beneath $0.220 following early-week declines. Weakening derivatives metrics and flagging momentum suggest the possibility of protracted consolidations for both tokens. Conversely, Zcash holds around $1,348 following the activation of its NU7 upgrade, which enhanced processing efficiency and redirected 60% of network fees into future protocol rewards. Institutional redemptions in Zcash moderated significantly to approximately $3.50 million on Monday, down from $93.56 million during the prior week.