
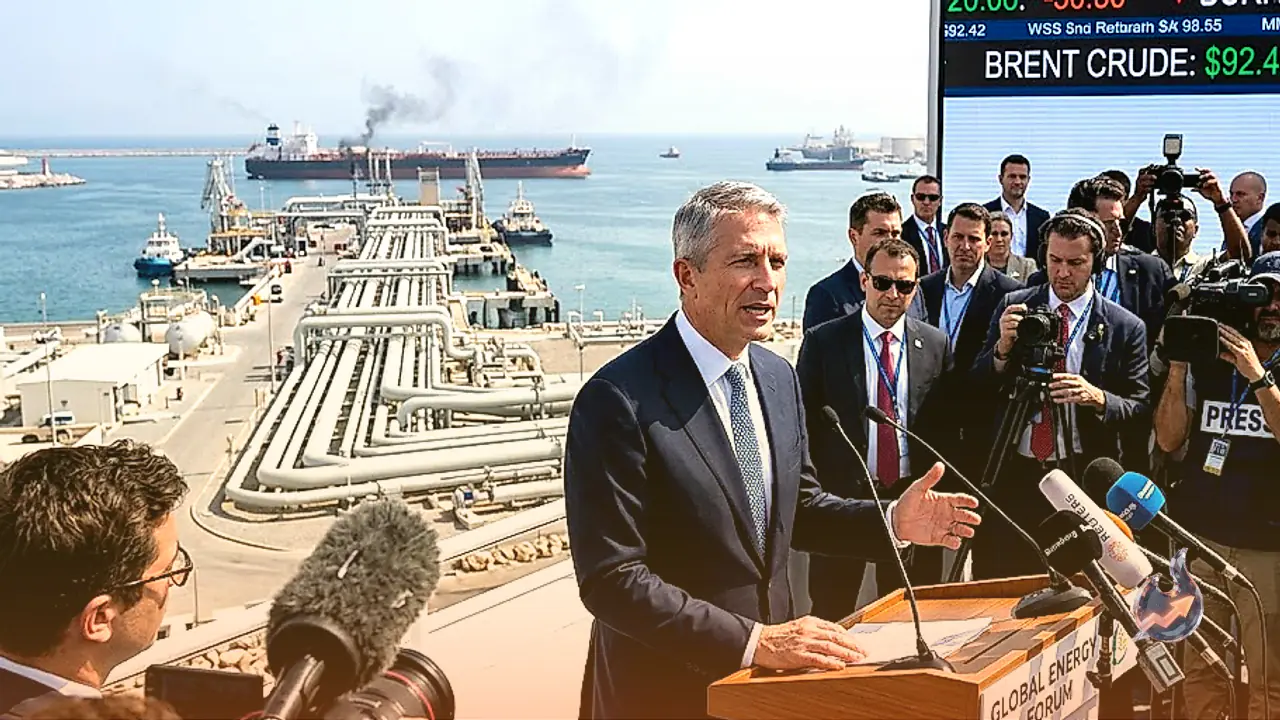























Crude oil prices experienced a sharp and sudden upward surge in international trading sessions. West Texas Intermediate, commonly known as WTI, pushed just shy of the $89.00 mark before holding steady just above $88.00. The commodity witnessed a rapid vertical climb, adding significant gains within a very brief window. Concurrently, Brent crude moved in tandem, approaching the $93.50 threshold. This notable repricing stems directly from fresh escalations and explosions reported along Iran's southern coastline, raising immediate supply concerns across the global energy landscape.
Strategic Significance of Targeted Southern Iranian Coasts
Reports citing government officials highlighted discussions regarding precise strategic measures aimed at curtailing maritime threats and safeguarding shipping lanes. Unlike earlier localized incidents, the recent wave of activity spanned a much broader geographic footprint along the southern coast. Critical infrastructure points including Bandar Abbas, Minab, Qeshm, Sirik, Jask, Konarak, and Chabahar were reportedly impacted. Jask serves as a vital terminal designed specifically to bypass the Strait of Hormuz, while Chabahar operates as Iran's primary ocean port outside the Persian Gulf. Targeting these alternative export routes shifts the market focus from mere transit delays to a permanent loss of barrel capacity.
Technical Levels and Market Bias
Analyzing the technical structure of the oil market reveals a distinctly bullish bias while crucial support thresholds remain intact. The session high near $89.00 acts as the immediate resistance ceiling that any continuation rally must breach. On the downside, the reclaimed August ceiling just beneath $87.50 provides the foundational support that must hold during pullbacks. Further back, the 50-day Exponential Moving Average positioned near $82.00 underpins the broader multi-week advance. Short-term momentum indicators like the stochastic readings indicate a potential for minor pullbacks before the next major directional push.
Fundamental Drivers of WTI Oil Pricing
WTI crude remains a premier global benchmark renowned for its low sulfur content and light gravity, making it exceptionally desirable for efficient refinery processing. Sourced primarily within the United States and distributed through major pipeline hubs, its valuation is fundamentally governed by global supply and demand dynamics. Macroeconomic growth, geopolitical conflicts, international sanctions, and production quotas established by major exporting coalitions heavily dictate price trajectories. Additionally, fluctuations in the US Dollar exert considerable influence, as petroleum is predominantly denominated in American currency.
Inventory Reports and Regulatory Impact
Weekly petroleum status updates published by industry groups and governmental bodies heavily influence short-term price movements. Data releases concerning crude inventories provide vital insights into shifting supply and demand balances. Unexpected drawdowns typically signal robust consumption and drive prices upward, whereas inventory builds introduce downward pressure. Furthermore, collective production adjustments by major oil-producing nations play a monumental role in tightening or loosening global crude availability.
Spillover Effects Across Global Financial Markets
The energy sector volatility has sent ripples through broader financial instruments. Major currency pairs, including foreign exchange benchmarks involving the US Dollar, are reacting to ongoing macroeconomic uncertainties and geopolitical tensions. Precious metals like gold have experienced fluctuating demand amid changing treasury yields. Meanwhile, digital assets and global sovereign bonds continue to exhibit reactive price action as institutional investors reassess risk exposure across international markets.