




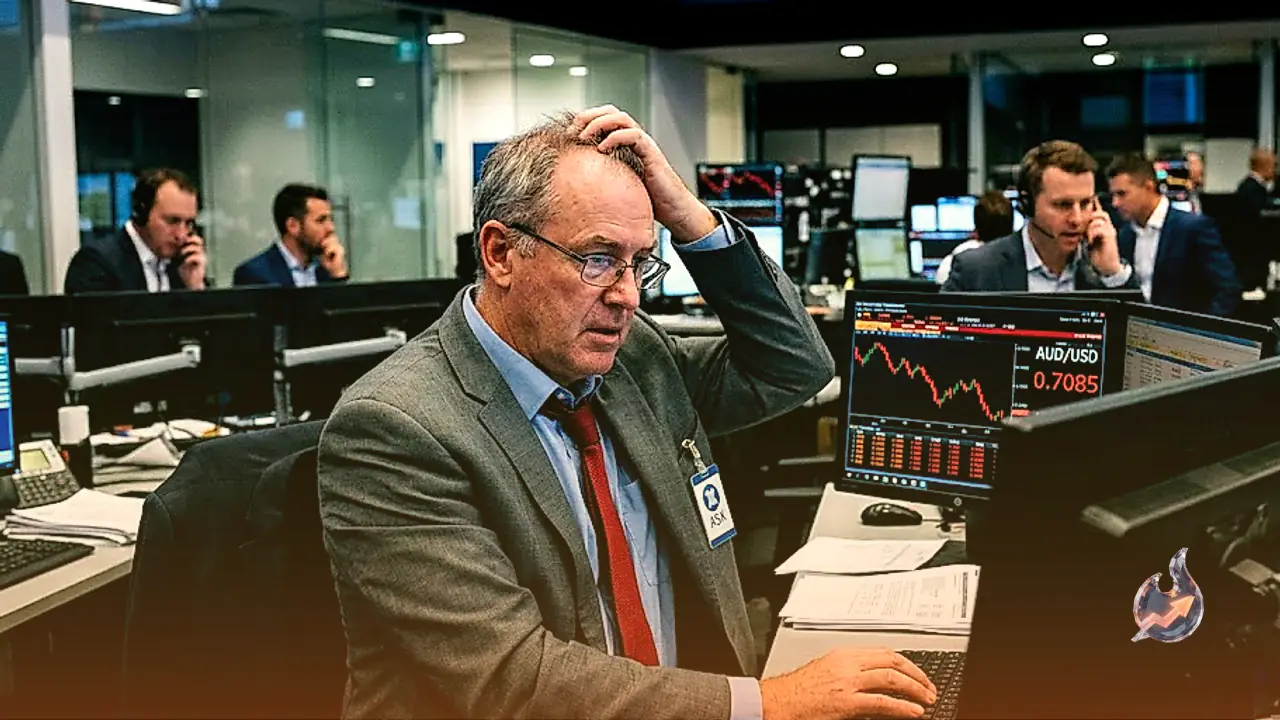




















Crude oil benchmarks arrested a five-session losing streak on Wednesday, driven by lingering concerns over Persian Gulf energy transport and ambiguous diplomatic signaling between Washington and Tehran. West Texas Intermediate traded back above the $92 per barrel threshold, staging a recovery of more than 2.5% from an intraday low of $88.27, which had marked its weakest valuation in over two weeks. Live closing figures positioned the commodity at $92.63, following a prior settlement of $94.59.
Diplomatic Exchanges Yield No Immediate Resolution
High-level diplomacy held on the fringes of the United Nations General Assembly in New York offered little immediate reassurance to energy markets. US Secretary of State Marco Rubio characterized the indirect discussions with Iranian delegates as constructive yet fundamentally unresolved, remarking that the exchange
“was positive, but it was not a breakthrough.”Rubio noted that the engagement was essentially an ongoing channel for conveying proposals rather than finalizing agreements.
A senior Iranian representative indicated that the lifting of the American blockade and the restoration of regular shipping across the Strait of Hormuz were central points of discussion. While confirming that substantial policy divides persist between the two governments, the Iranian diplomat reaffirmed that diplomatic contact remains operational. Energy desks interpreted the lack of concrete progress as a sign that geopolitical risk premiums must remain factored into pricing.
Strait of Hormuz Bottleneck Persists Despite Pipeline Rerouting
While Saudi Arabia helped alleviate localized export strains by bringing its East-West pipeline back into service, physical marine transit along the vital maritime corridor of Hormuz remains drastically curtailed. Tracking metrics compiled by Kpler revealed that only three commodity vessels navigated the chokepoint on Tuesday, slipping from four on Monday. This volume represents a steep decline against the recent 10-day running average of approximately 15 transits.
Given that a substantial fraction of global seaborne petroleum must traverse this narrow waterway, traders displayed strong hesitation to short oil contracts. The persistent disruption in vessel movement effectively countered the downward momentum generated by swelling crude stockpiles in North America.
EIA Inventories Defy Expectations With a Sizable Build
Physical inventory dynamics presented a contrasting fundamental signal. The Energy Information Administration revealed that domestic commercial crude reserves in the United States expanded by 2.969 million barrels during the latest reporting week. This figure ran sharply contrary to market consensus, which had penciled in a contraction of 0.7 million barrels following a draw of 0.64 million barrels in the previous week.
Market participants routinely monitor dual stockpile assessments: the industry-compiled American Petroleum Institute release on Tuesday afternoons and the official government figures from the EIA on Wednesdays. The two readings align within a 1% margin roughly 75% of the time, though institutional desks place primary trust in the EIA due to its statutory reporting mandate. While substantial builds typically suppress crude futures, the prevailing geopolitical backdrop muted the bearish inventory headline.
Structural Mechanics of West Texas Intermediate
West Texas Intermediate represents one of the primary light sweet grades that govern international petroleum pricing alongside North Sea Brent and Middle Eastern Dubai crude. Its designation as light and sweet stems from its lower density and low sulfur concentration, attributes that make it comparatively inexpensive and straightforward for refiners to process into transportation fuels. Extracted primarily across North American fields, WTI settles physically around the terminal hub in Cushing, Oklahoma, widely recognized as the pipeline crossroads of the world.
Broader valuation of the benchmark hinges on macroeconomic growth trajectories, producer policy, and currency fluctuations. Because crude oil contracts are denominated in US dollars, an appreciating greenback raises the effective cost of procurement for foreign buyers, dampening demand. Conversely, economic expansion and dollar depreciation generally provide a supportive backdrop for commodity prices.
The Role of OPEC and Extended Alliances
Supply-side intervention remains heavily influenced by the Organization of the Petroleum Exporting Countries, a 12-nation bloc that sets collective output quotas during semiannual ministerial gatherings. When member states decide to restrict supply, market deficits push prompt prices higher, whereas quota increases exert downward pressure. The wider OPEC+ coalition incorporates ten external producers, among which Russia holds the most significant market leverage, coordinating production targets to steer global balances.
Movements Across Global Currency and Precious Metals Desks
Cross-asset sentiment reflected broader macro themes across the Asian and European trading windows. The Australian dollar faced selling pressure against the greenback, sliding toward 0.7100 following soft purchasing managers index readings that showed domestic manufacturing falling into contraction while service activity slowed for a second consecutive month. Traders also maintained caution ahead of the scheduled summit between Trump and Xi.
In foreign exchange, USD/JPY held near mid-157.00s, hovering close to two-week peaks reached on Friday. The Bank of Japan adjusted its short-term policy interest rate target from 1.00% to 1.25% in a 7-2 vote, a widely anticipated adjustment that did little to reverse yen softness. Concurrently, expectations of persistent Federal Reserve monetary tightening lifted the dollar index, keeping spot gold (XAU/USD) under pressure as investors favored yield-bearing alternatives.
Technical Profile and Actionable Chart Levels
Crude oil trades within a wide 52-week band of $54.98 to $119.48. Current technical parameters indicate an RSI(14) of 49, sitting squarely in neutral territory. The MACD shows a line value of 3.30 against a signal threshold of 4.10, producing a negative histogram of -0.80. Key exponential moving averages stand at $94.66 for the 20-day, $89.69 for the 50-day, and $79.82 for the 200-day, validating a long-term bull trend bolstered by an active golden cross between the 50-day and 200-day EMAs.
Bollinger bands (20,2) span from lower support at $80.48 to an upper ceiling of $108.06, centering on a midline of $94.27. Trend strength as gauged by ADX(14) registers at 30, reflecting directional momentum, while the fast and signal stochastic lines sit at 22 and 34 respectively. Daily volatility measured via ATR(14) stands at 4.59. Near-term price discovery centers around a pivot point of $91.41, with upward resistance mapped at $94.11 (R1) and $95.59 (R2), and downside cushions positioned at $89.93 (S1) and $87.23 (S2).