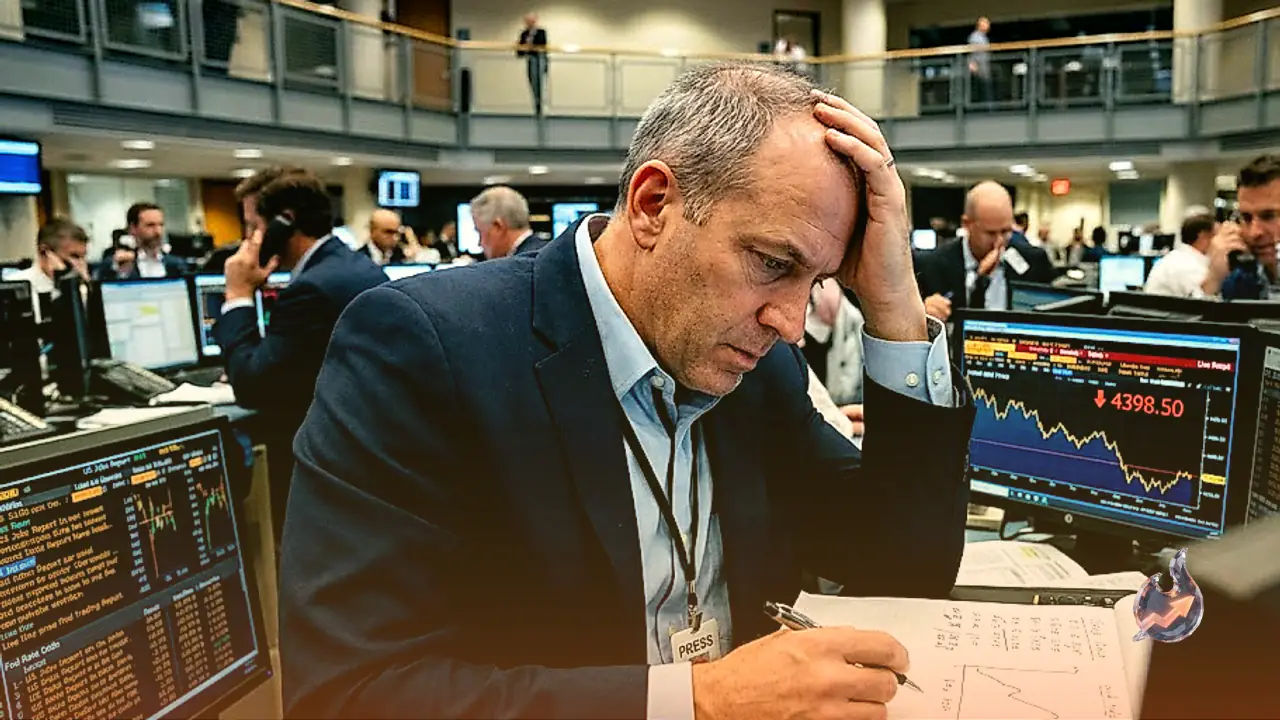

























Deutsche Bank analysts have drawn attention to a significant fragmentation in global equity markets over the past 24 hours. While investors might typically expect a synchronized global movement, the current landscape reveals a stark contrast across different continents. In the United States, equity markets have faced noticeable headwinds, characterized by a softer performance that saw the benchmark S&P 500 index edge slightly lower. However, the sentiment across the Atlantic and in parts of Asia painted a much more optimistic picture. European stock markets delivered a robust performance, with the broad-based STOXX 600 index climbing by a solid +0.58%. This indicates a resilient appetite for European assets despite broader global uncertainties. Similarly, key Asian benchmarks, including South Korea's KOSPI, Hong Kong's Hang Seng, and Japan's Nikkei, registered notable advances, reflecting localized optimism. The glaring exception to this Asian rally was mainland China. Both the CSI 300 and the Shanghai Composite indices slipped, falling by -0.20% and -0.19% respectively, as domestic economic concerns continue to weigh on investor confidence in the region.
Big Tech Earnings Spook Wall Street
The softness in the US markets was further compounded overnight as equity futures continued to lose ground, a direct reaction to highly anticipated earnings reports from tech behemoths Alphabet and Tesla, which were released after the market close. Alphabet's financial results initially appeared stellar, delivering a solid beat on both top-line revenue and bottom-line earnings. A standout metric was the blistering 82% year-over-year growth in its cloud computing division, which generated $24.8 billion in revenue, comfortably surpassing the estimated $22.5 billion. Yet, instead of celebrating, the market reacted defensively, sending Alphabet shares down by over -3% in extended trading. The catalyst for this sell-off was the company's forward-looking guidance, specifically a significant upward revision to its capital expenditure plans. Alphabet announced it expects capex to land in the range of $195 billion to $205 billion by 2026, noticeably higher than the $186 billion analysts had modeled. This surge in anticipated spending, largely driven by investments in artificial intelligence infrastructure, sparked fears about long-term profit margins.
Meanwhile, Tesla's earnings report triggered an even sharper reaction, with its stock plummeting by more than -4% in after-hours trading. Despite reporting solid automobile sales figures, the electric vehicle manufacturer revealed its first quarter of negative free cash flow in more than two years. This alarming cash burn was primarily driven by a staggering 47% year-over-year surge in operating costs. The combination of these two high-profile tech disappointments sent ripples through the broader market, dragging S&P 500 futures down by an additional -0.13% heading into the morning session.
Currency Markets Await Central Bank Cues
In the foreign exchange arena, currency pairs are navigating a complex web of inflation data, geopolitical tensions, and impending central bank decisions. The GBP/USD pair demonstrated resilience during the Asian trading session on Thursday, rebounding to trade near the 1.3385 level. However, market analysts caution that the upside potential for the British Pound may be capped in the near term. This limitation stems from a dual narrative: recently released UK inflation data came in cooler than expected, which could alter the Bank of England's interest rate trajectory, and simultaneously, escalating geopolitical tensions in the Middle East are driving investors toward traditional safe-haven assets rather than riskier currencies. Traders are now holding their breath for the upcoming UK Retail Sales report scheduled for Friday, which will provide further clarity on consumer health.
Concurrently, the EUR/USD pair extended its upward trajectory for a second consecutive day, hovering around the 1.1410 mark during Asian trading hours. The Euro is currently benefiting from solid underlying support as market participants position themselves ahead of the European Central Bank's highly anticipated interest rate decision. The overarching sentiment suggests that the ECB's forward guidance will be critical in dictating the near-term direction of the common currency.
Commodities React to Geopolitical Heat
Commodity markets are acutely reflecting the heightened state of global anxiety. Crude oil prices have surged to fresh highs not seen since June 11, driven entirely by the escalating geopolitical friction between the United States and Iran. This spike in energy costs is not just an isolated event; it has profound macroeconomic implications. Rising oil prices act as a direct catalyst for inflation, reigniting fears that consumer prices could remain stubbornly high. Consequently, this dynamic is actively bolstering expectations that the US Federal Reserve may be forced to maintain or even hike interest rates to combat energy-driven inflationary pressures.
In tandem with the volatility in oil, Gold is solidifying its position as the ultimate safe-haven asset. The precious metal is currently consolidating comfortably above the psychological $4,100 round figure through the Asian session. This price action indicates that Gold has effectively stalled its modest pullback from the over two-week highs it touched during the previous trading day, as investors continue to seek refuge amidst the swirling geopolitical and economic uncertainties.
Crypto's Emerging Resilience and XRP Technical Analysis
In the digital asset space, a fascinating narrative of institutional adoption and market resilience is taking shape. According to a recent report by Bitwise Chief Investment Officer Matt Hougan, the foundation for the next major cryptocurrency bull market is being laid by the accelerating convergence between blockchain-based financial infrastructure and the traditional finance sector. Hougan's late Tuesday report highlights that the crypto market may be flashing early signs of a definitive macro bottom. This thesis is supported by a noticeable decoupling in performance metrics; for instance, Bitcoin has managed to gain an impressive 9% since July 1, standing in stark contrast to the technology-heavy NASDAQ 100 index, which declined by 6% over the same period.
However, not all digital assets are experiencing aggressive upside momentum. Ripple and Stellar are currently trading with significant caution as both tokens navigate critical technical junctures. XLM continues to consolidate its price action around a vital support zone at $0.187. Meanwhile, looking at live market data as of the close-bell session, XRP is currently trading at $1.13, down a slight -0.68% from its previous close of $1.14, operating within a 52-week range of $1.01 to $2.41. The trading volume sits at 0.85 times its 20-day average, indicating a lack of aggressive buying pressure.
From a technical standpoint, XRP is facing immediate resistance as it tests its 50-day Exponential Moving Average (EMA) positioned exactly at $1.14. The asset remains entrenched in a long-term downtrend, confirmed by a bearish death cross where the 50-day EMA ($1.14) has crossed below the 200-day EMA ($1.48). The Relative Strength Index (RSI) registers at a neutral 55, while the MACD sits flat at 0.00 against a signal line of -0.01, though showing a slightly bullish histogram of 0.01. Price action is currently contained within the Bollinger Bands, hovering near the midpoint of $1.11, with the upper and lower bands at $1.16 and $1.06 respectively. With the Average Directional Index (ADX) at a weak 13, the trend lacks definitive strength. Traders eyeing entry or exit points are watching key support levels at $1.13 and $1.12, with overhead resistance at the $1.14 pivot and $1.15. The mixed derivatives data, coupled with a slight bearish tilt, suggests that the market remains highly cautious, leaving the token's next major directional move uncertain.