























Gold prices displayed modest resilience during Tuesday's Asian trading session, finding tentative buying interest near the $4,284-$4,283 zone and edging away from an over one-month low touched earlier in the week. Despite this minor bounce, broader upside traction remains noticeably constrained against a fundamentally challenging environment, dominated by elevated borrowing costs and anticipation surrounding the Federal Open Market Committee policy meeting.
Federal Reserve Meeting and Persistent Rate Hike Expectations
The Federal Reserve's imminent rate verdict serves as the primary focal point for global market participants, particularly after recent consumer inflation metrics reignited speculation around tighter borrowing conditions. Beyond the immediate policy rate outcome, market scrutiny is concentrated on the updated Summary of Economic Projections, famously referred to as the dot plot, alongside detailed remarks by Fed Chair Kevin Warsh during the scheduled press briefing. Clarifications regarding the medium-term trajectory of borrowing costs will dictate the valuation of the US Dollar, thereby shaping the price action for non-yielding bullion.
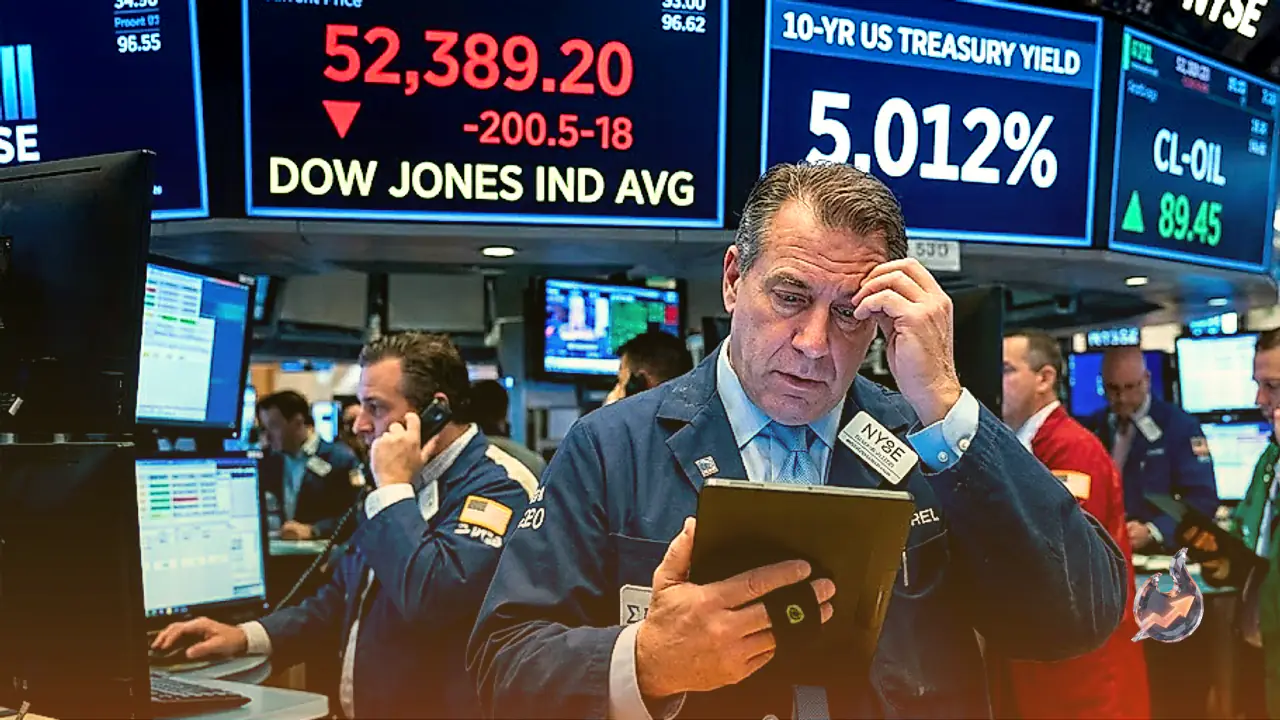
Inflation risks stemming from elevated energy markets have reinforced projections for sustained policy restraint by the central bank. Compounding these pressures, an unprecedented wave of public and corporate debt issuance triggered an extensive worldwide bond selloff. Consequently, the benchmark 10-year US Treasury bond yield surged past the critical 5% threshold, reaching territory not witnessed since 2023. These elevated returns on risk-free debt, paired with broad resilience in the greenback near a two-week peak, present a formidable barrier against sustained rallies in precious metals.
Middle East Hostilities Reinforce Safe-Haven Greenback
Geopolitical tensions in the Middle East have intensified, introducing renewed caution across global asset classes. In Yemen, Iran-backed Houthi forces launched an extensive missile and drone assault targeting a Saudi military air base situated in Khamis Mushait. Concurrently, Iranian Supreme National Security Council Secretary Mohsen Rezaei dismissed the prospect of immediate diplomatic engagement with Washington, asserting that Tehran will refrain from restarting talks until its core stipulations are addressed. These escalations have dampened expectations for a swift diplomatic resolution, underpinning safe-haven flows toward the US Dollar and deterring aggressive bullish positions in bullion.
Technical Indicators and Structural Levels
From a chart perspective, XAU/USD exhibits a consolidated, capped posture, trading just beneath the 50.0% Fibonacci retracement of the broader June-August upward move while maintaining ground above its 50-day Simple Moving Average (SMA). Momentum readings remain relatively flat, with the Relative Strength Index (RSI) hovering near 45, indicating subdued directional conviction. Concurrently, the Moving Average Convergence Divergence (MACD) histogram remains in negative territory, highlighting that any short-term rebound may encounter heavy selling unless price convincingly clears overhead resistance barriers.
A sustained break above the 50.0% retracement at approximately $4,323 would encounter intermediate resistance at the 38.2% Fibonacci retracement near $4,412, followed by the 23.6% barrier at $4,522. Conversely, initial technical defense rests at the 50-day SMA near $4,275, directly ahead of the 61.8% Fibonacci retracement around $4,234. A decisive breach beneath this cluster would leave gold exposed to deeper corrective targets, including the 78.6% retracement zone around $4,108 and the prior foundational base located near $3,947.
Broader Foreign Exchange and Cryptocurrency Trends
The US Dollar exhibited broad strength across major currency pairs, emerging as exceptionally robust against the New Zealand Dollar. In regional foreign exchange, the Australian Dollar (AUD/USD) remained pinned below 0.7150 during Asian trading hours, lingering near its multi-week lows. Surging US Treasury yields and oil-fueled inflation concerns bolstered the greenback, while mixed industrial activity data from China for August failed to provide meaningful support for the Aussie.
Meanwhile, the USD/JPY pair advanced steadily toward the 155.00 psychological barrier as investors evaluated policy paths ahead of meetings by both the Federal Reserve and the Bank of Japan. While persistent rate hike bets in the US favored dollar bulls, growing anticipation of potential monetary policy normalization by Japanese authorities provided an underlying floor for the Japanese Yen, potentially tempering extended gains in the currency pair. In the digital asset space, Bitcoin stabilized near $78,000, maintaining a 2% recovery amidst heightened volatility surrounding the scheduled CLARITY Act cloture vote, with Zcash and Stellar recording outsized 24-hour performance.
Live Technical and Market Readings
According to live market readings, Gold futures (GC=F) are trading at $4,425, registering a 0.57% advance against the previous settlement of $4,400. The metal retains a 52-week trading corridor spanning $3,664 to $5,586, with current trading volume registering at 0.90 times its 20-day historical average. The 14-period RSI sits neutral at 50. Technical momentum displays a bearish MACD configuration, marked by a line reading of -1.38 against a signal reading of 19.46, yielding a histogram of -20.83. Key moving averages show the 20-day EMA at $4,430, the 50-day EMA at $4,393, and the 200-day EMA at $4,426, whereas the 50-day SMA resides at $4,325 and the 200-day SMA stands at $4,553. Technical pivot points outline primary resistance at R1 $4,452 and R2 $4,480 against a central pivot of $4,412, alongside downside supports at S1 $4,385 and S2 $4,345.