




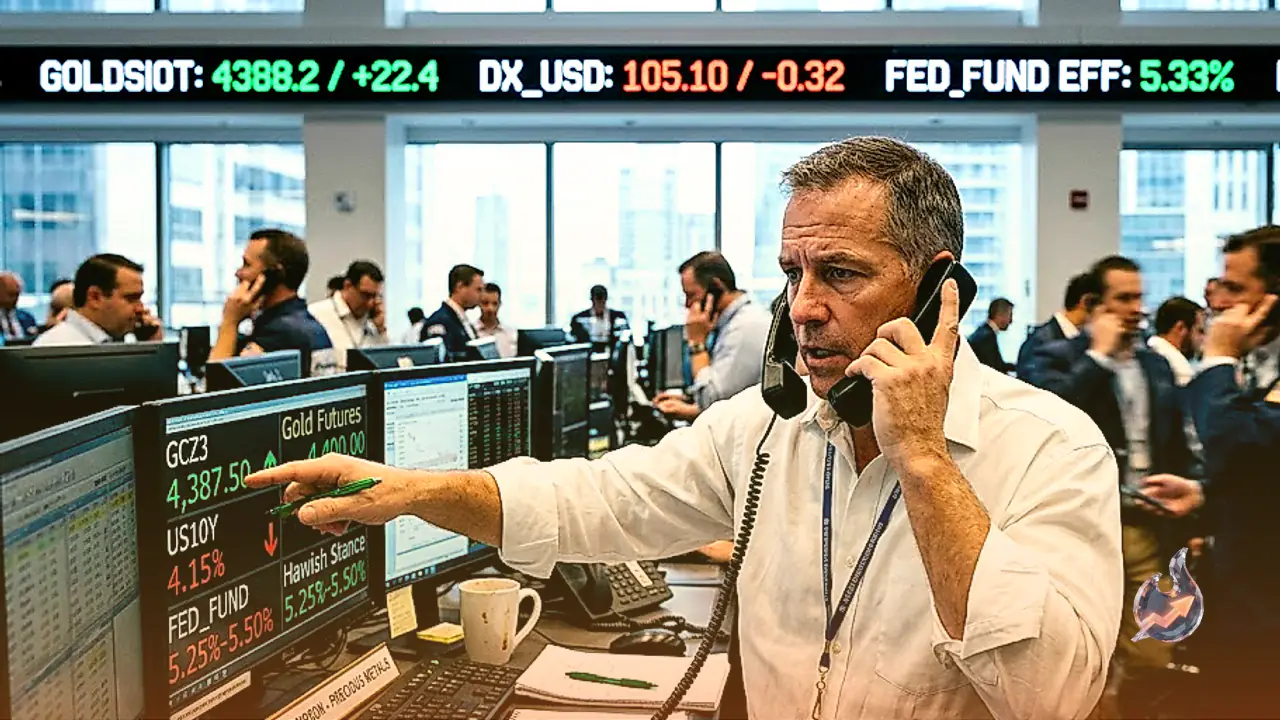




















Financial markets have moved into a phase of post-policy consolidation as currency and debt instruments digest recent signals from the Federal Reserve. A mild retracement in US Treasury yields and crude oil prices following their initial post-FOMC advances has removed immediate upward momentum from the greenback. Investors are now assessing whether the Federal Reserve's higher-for-longer policy trajectory has already been absorbed by market participants, or if upcoming macroeconomic releases will be required to drive another leg higher in currency valuations.
Treasury Yield Dynamics and Key US Dollar Technical Thresholds
OCBC strategist Christopher Wong noted that the US Dollar eased modestly as Treasury yields pulled back partially from their post-FOMC spikes alongside softening crude benchmarks. Wong characterized the recent trading environment as typical consolidation while markets work through policy reactions. While the Federal Reserve's restrictive policy stance remains structurally supportive of the currency, substantial hawkish expectations have already been priced into current exchange rates. Consequently, extended upside in the Dollar Index is likely contingent on benchmark yields staging another sustained leg higher.
The Dollar Index (DXY) was recently recorded at the 100.2 mark. While daily momentum continues to flash positive signals, the Relative Strength Index (RSI) has displayed tentative signs of easing downward from near-overbought thresholds. Technical levels outline primary resistance at 100.32, which marks the 23.6% Fibonacci retracement of the 2026 low-to-high move, with secondary resistance positioned at 100.60. On the downside, critical support spans the 100.00 to 99.80 zone, reinforced by the 50-day and 100-day moving averages. Deeper technical cushions emerge at 99.4 (the 38.2% Fibonacci retracement) and 99.2 (coinciding with the 21-day and 200-day moving averages). Wong cautioned that any evident softening in broad economic activity, labor market conditions, or consumer inflation prints could trigger an unwinding of elevated policy rate pricing, potentially reopening downward pressure on the currency.
Japanese Yen Faces Persistent Pressure Despite Rate Adjustment
In contrast to the broader dollar consolidation, the Japanese Yen has extended its retreat against major counterparts. The Bank of Japan (BoJ) implemented an anticipated interest rate increase to 1.25%, accompanied by firm policy rhetoric from Governor Kazuo Ueda. However, the decision was complicated by two unexpected dissenting votes against tightening, which injected immediate uncertainty regarding the domestic policy consensus and undermined yen sentiment.
During Friday's European session, the USD/JPY currency pair resumed its upward trajectory, testing two-week highs in the vicinity of 158.00. Current market metrics place USD/JPY at 156.85, marking a 0.46% advance from the prior close of 156.13, within a 52-week trading span of 146.61 to 163.98. Key technical readings show the 14-period RSI holding steady at 49, while the MACD stands at -1.05 against a signal line of -1.24, producing a bullish histogram reading of 0.19. The pair's exponential moving averages stand at 156.47 (20 EMA), 158.10 (50 EMA), and 157.62 (200 EMA), with simple moving averages located at 159.04 (50 SMA) and 158.40 (200 SMA). The daily average true range (ATR) is 1.47, with 20-day technical support identified near 152.90 and resistance around 160.38. For more than a decade, Japan's negative and near-zero rates provided a low-cost funding engine that channeled trillions of dollars into global markets, and the Bank of Japan's ongoing exit from ultra-loose settings continues to redefine that structural advantage.
Australian Dollar, Precious Metals, and Digital Asset Developments
Cross-market asset classes have exhibited distinct reactions to softening US yields. The Australian Dollar (AUD/USD) demonstrated positive upward momentum for a second consecutive session, maintaining ground above 0.7100 during Friday's Asian trading. Softer Treasury yields kept dollar buyers constrained, while restrictive guidance from Reserve Bank of Australia (RBA) Governor Michele Bullock bolstered expectations for further policy tightening, lending direct support to the Australian currency. Nonetheless, broader geopolitical developments and the Federal Reserve's long-term policy stance have restrained more aggressive upside follow-through.
Concurrently, gold prices advanced for a second straight session, registering fresh weekly highs through the first half of European trading. Market participants are watching for confirmation of a decisive breakout beyond the $4,400 per ounce threshold before establishing broader upside exposure. The pullback in Treasury yields has placed a ceiling on the dollar's recovery, offering support to bullion prior to upcoming central bank communications and second-tier macroeconomic data.
In the digital asset sector, Bitcoin (BTC) has rebounded noticeably since touching a yearly low of $57,800 in July. The asset climbed approximately 33%, achieving back-to-back monthly gains across July and August. Despite this recovery, Bitcoin trades roughly 40% below its historical peak. Market participants remain focused on determining whether this upward trajectory signals the foundation of an emerging structural bull market or represents a temporary counter-trend recovery within a wider corrective phase.