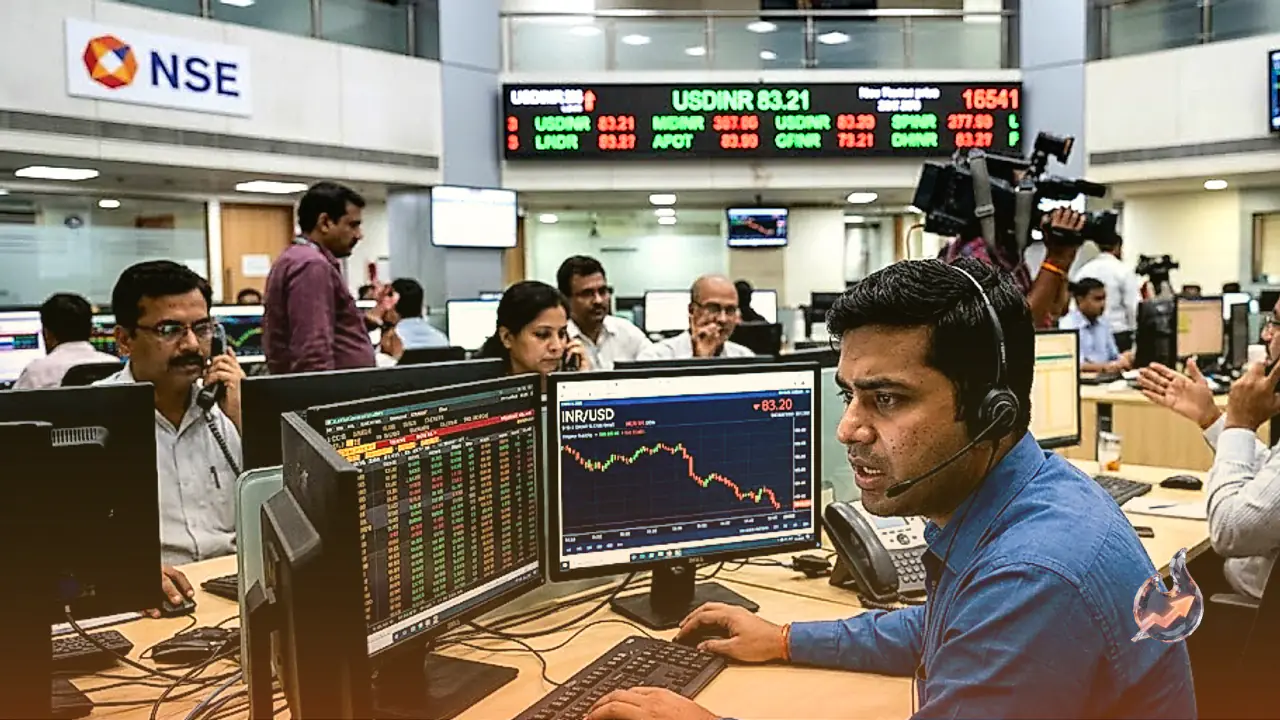
























The Indian Rupee experienced a substantial rally on Thursday morning, ascending to a fresh two-month high against the US Dollar as exchange rates descended toward the 94.28 level. This sharp currency movement reflects a robust combination of domestic capital accumulation and shifting global macroeconomic dynamics. Primary drivers behind the Rupee’s upward momentum include massive foreign exchange inflows under a specialized deposit window established by the Reserve Bank of India, alongside a broader pullback in the US Dollar Index following weaker-than-anticipated private employment figures in the United States. Furthermore, recent economic indicators showcase that the Indian macro environment is sustaining high growth momentum, providing substantial fundamental backing for the domestic currency.
Central bank reserves in India received a historic boost through the Reserve Bank of India’s Foreign Currency Non-Resident (FCNR) (B) deposit window. Official central bank data confirms that India attracted an extraordinary $136.38 billion through these specialized foreign-currency mobilization programs. This figure surpassed consensus projections by a wide margin, granting the central bank expanded financial headroom to cushion domestic markets against external headwinds. Over recent months, monetary authorities engaged in active market operations across both spot foreign exchange markets and Non-Deliverable Forward (NDF) channels. These direct interventions were designed to insulate the Indian currency from sharp, one-sided volatility triggered by global geopolitical friction and fluctuating energy costs.
Strong Economic Growth Beats Central Bank Forecasts
Adding fundamental strength to the currency rally, India’s economic growth performance for the second quarter of FY26 significantly outperformed official estimates. Market analysis from financial institution Societe Generale highlighted that real Gross Domestic Product (GDP) growth for 2Q26 reached 7.8% year-on-year. This expansion stood 80 basis points above the Reserve Bank of India’s benchmark forecast, demonstrating that aggregate domestic demand is absorbing tighter financial conditions and adverse global developments far more effectively than previously anticipated.
Analytical observations emphasize that the growth acceleration was well distributed across major economic sectors. Real Gross Value Added (GVA) expanded by 8.2%, propelled by a stellar 10.0% surge in the services sector and a robust 9.2% rise in manufacturing activity. Furthermore, gross fixed capital formation recorded an 11.9% increase, signaling strong capital investment across the economy, while private final consumption expenditure rose by 7.1%. Market strategists at Societe Generale noted that this impressive performance follows an extensive upward revision of 0.80 percentage points to both real GDP and real GVA growth for 1Q26. Consequently, the reduced downside risk to economic output lowers the prospective growth trade-off of further monetary policy tightening, indicating that the Indian economy is operating with less spare capacity than implied by the RBI’s full-year FY27 growth target of 6.7%.
US Private Employment Softens as Dollar Index Declines
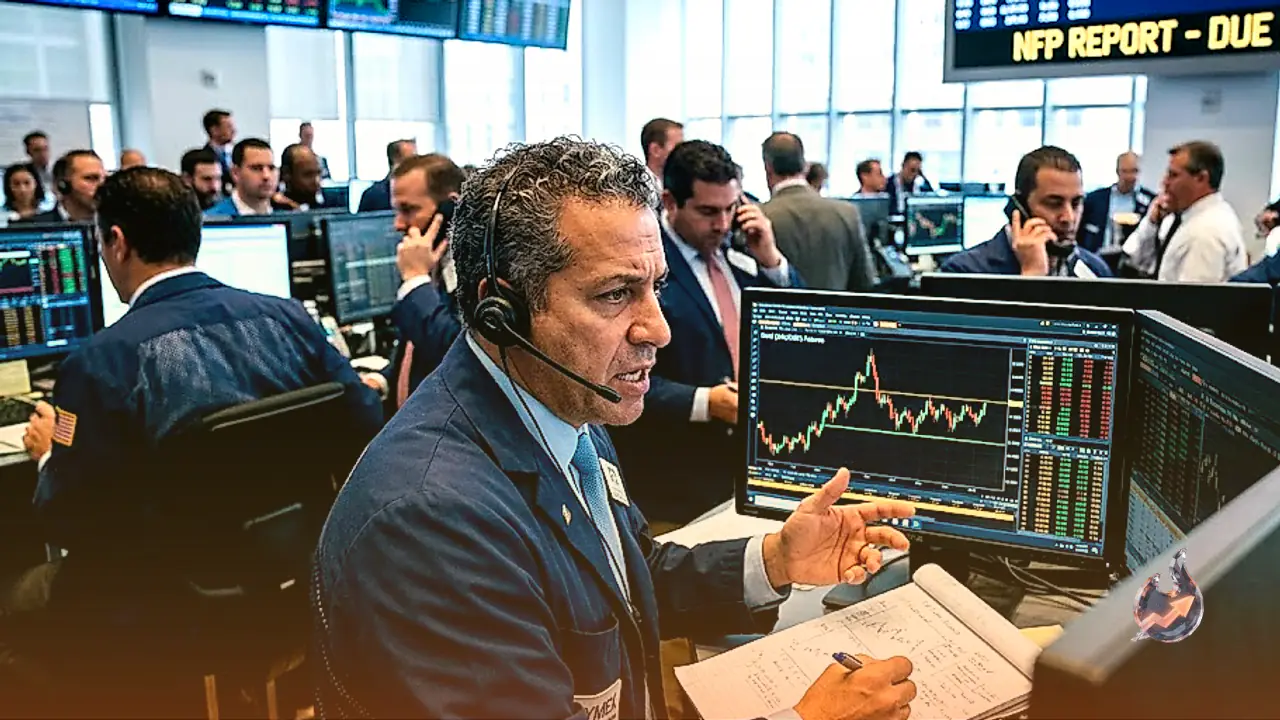
On the international front, the US Dollar Index (DXY), which tracks the Greenback against a basket of six major global currencies, faced persistent selling pressure. After taking a steep downward turn during the previous session, the index extended its slide to near 99.38 during Thursday’s Asian trading window. The weakening of the US Dollar was largely triggered by soft private sector employment numbers released by US ADP. The private payroll processor reported the creation of 38K net new jobs in August, missing the market expectations of 47K and coming in below the previous month’s figure of 46K. This cooler employment readout has raised market caution ahead of the comprehensive Nonfarm Payrolls (NFP) report scheduled for Friday publication.
Technical Chart Structure and Oscillators for USD/INR
From a technical analysis perspective, the USD/INR currency pair continues to exhibit a distinct bearish bias on the daily chart. Spot prices are trading around 94.48, remaining positioned beneath the 20-period Exponential Moving Average (EMA) located at 95.32. The persistence of price action below this critical trend indicator reinforces the prevailing downward structure for the pair in the near term.
Technical momentum indicators further reflect severe selling pressure. The 14-period Relative Strength Index (RSI) has dropped to 27.96, placing the instrument deep within oversold territory. While oversold conditions signify strong selling dominance, they also suggest that downside momentum could begin to stabilize or encounter consolidation if spot rates hold below the 95.00 threshold. On the upside, immediate technical resistance is pegged at the 20-day EMA of 95.32. A decisive daily candlestick close above this level would be required to neutralize short-term downside pressure and pave the way for a corrective bounce. Conversely, extended downside movement is expected to test primary support around the June 25 swing low of 94.16.
Macroeconomic Drivers Shaping the Indian Rupee
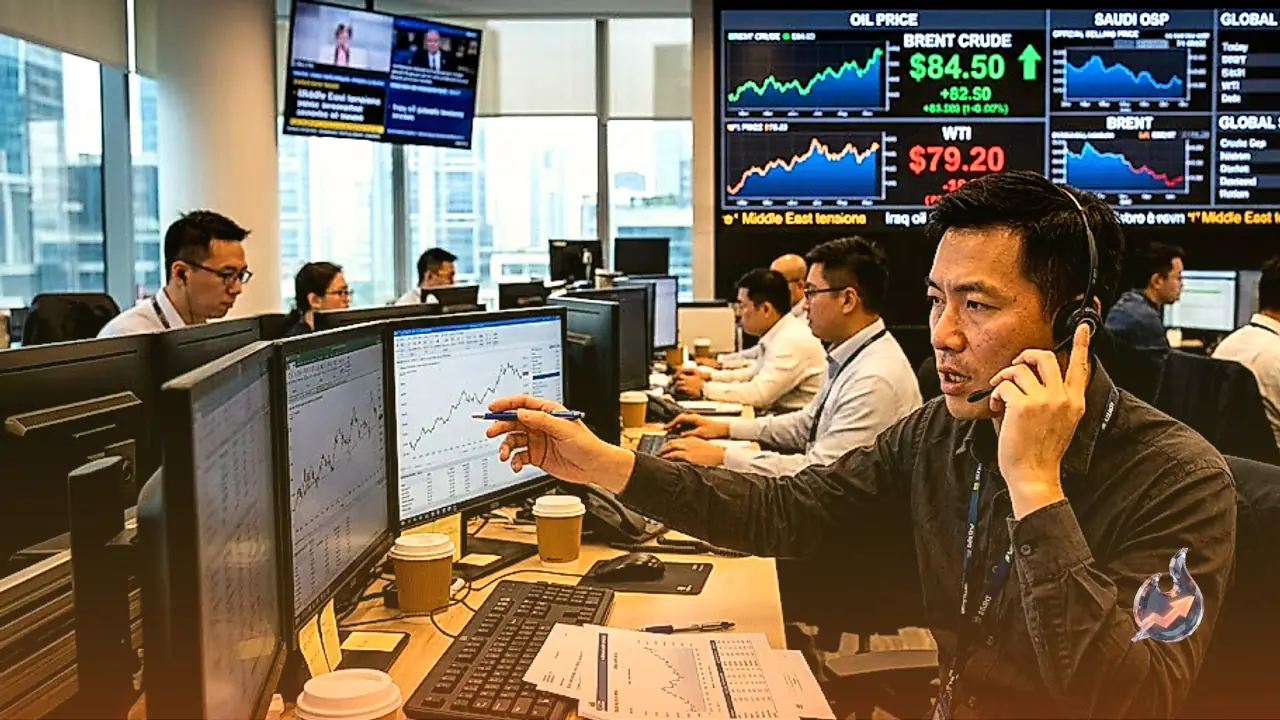
The valuation of the Indian Rupee remains highly sensitive to a complex interplay of internal policy choices and external macroeconomic variables. Given India’s heavy reliance on imported crude oil to meet energy demands, international petroleum price fluctuations directly impact the nation’s current account balance and currency demand. Additionally, because the majority of global commercial trade is denominated in US Dollars, shifts in the value of the Greenback exert immediate influence on domestic exchange rates.
Monetary policy actions by the Reserve Bank of India play a central role in maintaining currency equilibrium. The central bank actively manages interest rate settings to keep domestic retail inflation aligned with its 4% target. Higher domestic interest rates generally bolster currency value by encouraging carry trade operations, wherein global investors borrow funds in low-yield jurisdictions to invest in higher-yielding Indian assets. Broader macroeconomic determinants, such as economic growth rates, foreign direct investment (FDI), foreign institutional investment (FII) capital flows, and trade balance dynamics, collectively shape market demand for the Rupee. Elevated economic growth attracts international capital, whereas manageable trade deficits limit currency depreciation. While high inflation can erode domestic purchasing power and elevate import costs, it frequently prompts central bank rate hikes, which can ultimately generate renewed foreign demand for domestic yield.
Cross-Asset Movements Across Global Forex, Crypto, and Commodities
The weakness in the US Dollar reverberated across wider international financial markets during Thursday’s session. In Asian foreign exchange trading, the USD/JPY pair extended its decline below 158.00 as market participants reacted to the disappointing US employment data. The Japanese Yen gained additional support from hawkish Bank of Japan monetary expectations alongside persistent risks of currency intervention by Japanese authorities.
Meanwhile, the AUD/USD pair traded in a defined range above 0.7150. Australian dollar upside remained constrained as soft domestic trade balance data offset positive market sentiment generated by China’s RatingDog Services PMI. However, further declines in the pair were checked by broader US Dollar weakness, even as geopolitical friction involving the United States and Iran, coupled with expectations of a September Federal Reserve interest rate cut, influenced sentiment. In digital asset markets, Ripple (XRP) demonstrated price stabilization near a key technical support zone, whereas Stellar (XLM) slid beneath a cluster of exponential moving averages. In energy markets, refined products displayed notable divergence; the US diesel crack spread, measuring the premium of ultra-low sulphur diesel futures over WTI crude, surged past $100 per barrel to set a record intraday high above $102.00.