





















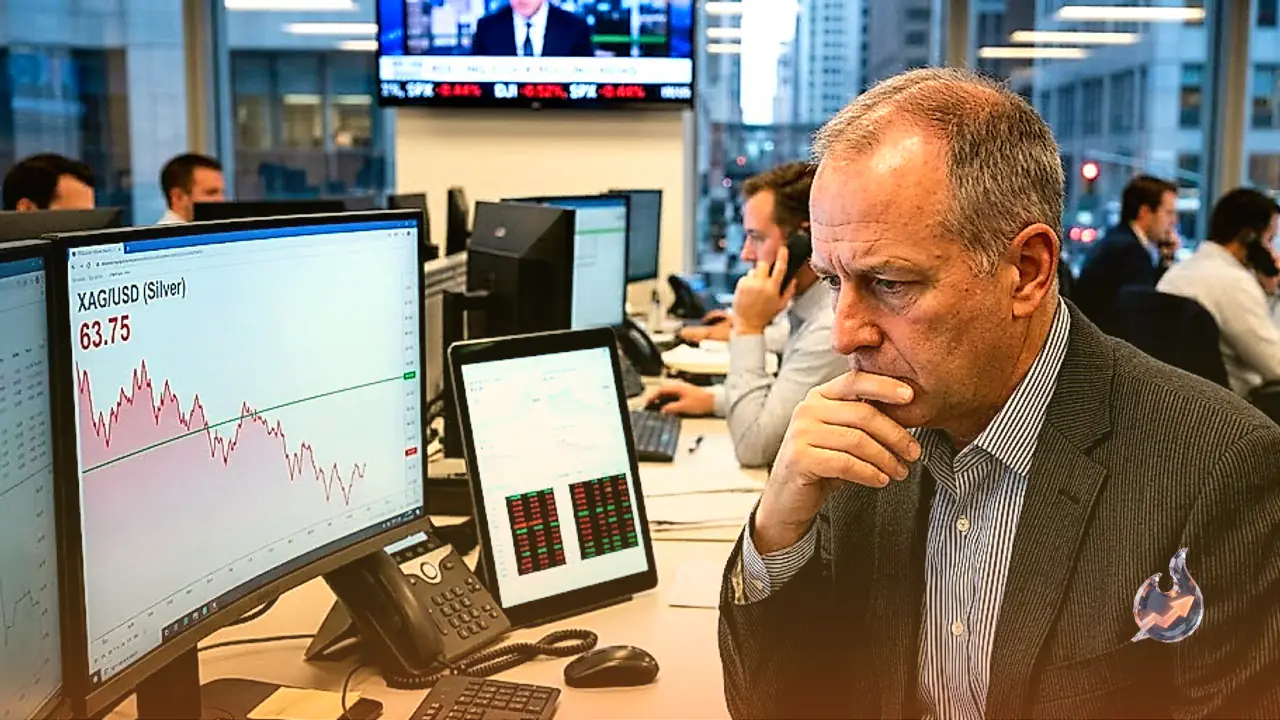

Selling momentum has regained firm control over the international silver market as bullish traders fell short of reclaiming vital technical resistance. During Monday's session, the spot silver pair (XAG/USD) retreated by more than 1.50% to hover near $63.60. The failure to clear the key overhead neckline resistance in the $64.10 to $64.20 band has kept a major head-and-shoulders chart pattern active, significantly escalating the probability of steeper downside moves in the near term.
Technical Indicators Signal Bearish Domination and Key Support Zones
From a chartist perspective, the head-and-shoulders structure remains the primary technical driver, even though broader downside momentum appears partially tempered as shown by the Relative Strength Index (RSI). The momentum indicator has dipped below the neutral 50 threshold, confirming that short-term price action remains tilted in favor of aggressive sellers. A reading below mid-line neutrality generally signals that rebounds are likely to be treated as selling opportunities rather than sustainable trend reversals.
In terms of downside trajectory, immediate support for silver is anchored at the $63.00 handle. A clear and sustained breakdown below this threshold would immediately expose the 50-day Simple Moving Average (SMA) currently hovering at $62.59, followed shortly by the $62.00 round figure. If market liquidation intensifies, the price could slide straight into the $60.00 psychological zone. Beyond that, the full measured objective derived from the head-and-shoulders pattern points toward the $55.00 mark, presenting a substantial downside risk for unhedged market participants.
Live market metrics show silver futures (SI=F) trading at $66.56, rising 1.66% from the previous close of $65.47. Over the trailing 52-week timeframe, the asset has oscillated between $41.81 and $121.30, with trading volume standing at 0.10 times its 20-day average. The technical setup features a 14-day RSI of 55, alongside a MACD reading of 0.20 against a signal line of 0.46 (negative histogram at -0.26, indicating underlying weakness). Exponential moving averages show the 20-day EMA at $65.31, the 50-day EMA at $64.99, and the 200-day EMA at $66.67, confirming an active death cross where the 50-day EMA trails below the 200-day EMA. The 50-day SMA sits at $62.94 while the 200-day SMA is at $72.48. Bollinger Bands spanning 20 periods indicate a range from $62.51 to $70.06 with a midpoint at $66.29. The 14-day ADX sits at 15, reflecting a non-trending sideways environment, whereas the stochastic indicator reflects a fast line at 70 and a signal line at 38. The Average True Range (ATR) over 14 periods stands at 1.73. Critical intraday references position the pivot at $66.68, resistance levels at $66.81 (R1) and $67.07 (R2), and floor support at $66.43 (S1) and $66.30 (S2).
Role as a Value Store, Portfolio Diversifier and Safe-Haven Asset
Silver occupies an essential position among precious metals and sees intensive trading activity across global institutional and retail desks. For centuries, it has served as both a reliable store of wealth and an accepted transaction medium. While gold commands a larger share of headline attention, investors frequently turn to silver to introduce asset diversification, access underlying intrinsic value, or insulate their holdings against the erosive effects of stubborn inflation. Market participants can gain direct exposure through physical holdings like minted coins and bullion bars, or trade via synthetic instruments such as Exchange Traded Funds (ETFs) that mirror international spot prices.
Pricing dynamics across the silver spectrum respond to a delicate interplay of macroeconomic and structural forces. Heightened geopolitical conflict or looming risks of severe economic contraction tend to spark safe-haven inflows into silver, though typically with less intensity than into gold. Furthermore, because silver generates no intrinsic yield, its investment appeal brightens whenever interest rates decline. Foreign exchange dynamics also play a commanding role: because the asset is denominated in US dollars (XAG/USD), a surging greenback exerts downward pressure on commodity quotes, whereas dollar depreciation provides a direct lift to international prices. Physical mining output, recycling supplies, and retail investment appetites further modulate balance sheets, particularly given that silver is mined in significantly larger volumes than gold.
Industrial Consumption Dynamics and the Gold/Silver Valuation Ratio
Unlike gold, silver derives a large portion of its fundamental demand from industrial manufacturing, holding a particularly dominant footprint in electronics assembly and photovoltaic solar technology. This indispensable commercial role stems from the fact that silver exhibits the highest electrical conductivity of any metal on earth, outperforming both copper and gold. Consequently, broad surges in factory activity tend to drive prices higher, whereas manufacturing slowdowns suppress demand. Macro conditions across key economic engines—the United States, China, and India—are pivotal. American and Chinese factories consume immense quantities of silver for specialized technological processes, while in India, consumer appetite for physical jewellery and silverware serves as a bedrock driver of global physical demand.
Historically, silver trends mirror gold price trajectories. When gold embarks on an upward trajectory, silver frequently follows suit due to their shared perception as defensive stores of value. Analysts and portfolio managers track the Gold/Silver ratio—the quantity of silver ounces required to purchase a single ounce of gold—to evaluate relative pricing imbalances. A historically elevated ratio is commonly viewed by market participants as evidence that silver is undervalued relative to gold, or that gold is stretched too high. Conversely, a compressed ratio signals that gold might be underpriced in comparison to its white metal counterpart.
Currency Markets, Gold Trajectory and Crypto Developments
Broad dollar strength echoed across foreign exchange and commodity boards on Monday. The Australian dollar traded under sustained pressure, slipping toward 0.7100 before staging a modest recovery to the 0.7150 mark ahead of Asian trading hours. The greenback's commanding run battered risk-sensitive currencies, dragging the Aussie to fresh monthly lows amid escalating bets on a Federal Reserve rate hike this week, with market participants turning their immediate focus toward upcoming economic data releases out of China.
Concurrently, USD/JPY found supportive bids at the start of the week, advancing toward the 154.00 zone during Asian trade to claw back a segment of Friday's declines. Even with this rebound, spot prices remained locked inside their multi-day consolidation bracket, lingering close to the near seven-month low logged last Tuesday as market participants awaited pivotal central bank announcements. Gold managed to muster positive momentum, testing the psychologically prominent $4,300 per troy ounce threshold on Monday; nevertheless, sharp greenback strength and elevated US Treasury yields continued to cap its broader advances.
In digital asset markets, JasmyCoin demonstrated tentative signs of bottoming out, though the token remained pinned between support at $0.0035 and overhead resistance at $0.0040. Since reaching a peak of $0.0078 in May, its broader chart structure has degraded substantially, leaving bears firmly in control as buyers struggle to defend critical floors. In the macro landscape, expectations of a Federal Reserve rate hike gained fresh traction following recent PPI and CPI prints. The central bank's updated dot plot is set to steer the dollar's subsequent trajectory, while Kevin Warsh's policy independence faces scrutiny against Donald Trump's vocal calls for lower interest rates, underscoring that the dollar needs hawkish policy confirmations to sustain its advance.