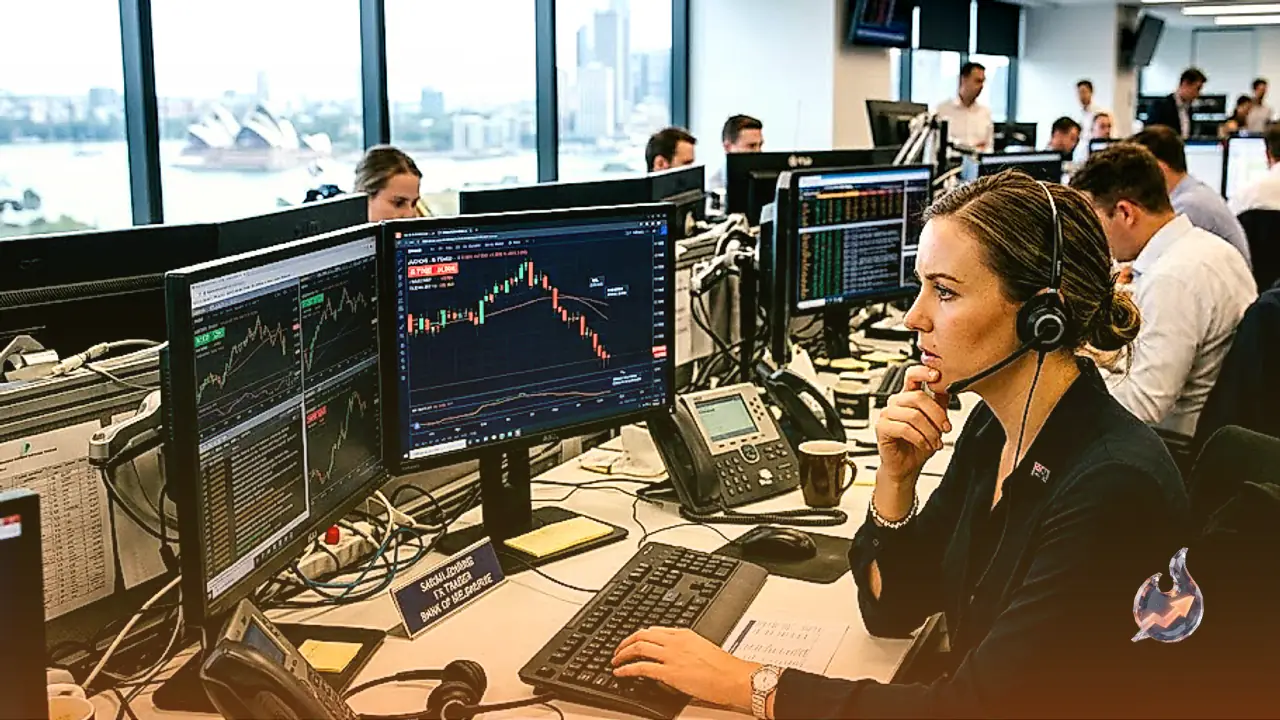
























Precious metal markets experienced intense selling pressure as silver (XAG/USD) suffered a sharp technical selloff, breaching a critical head-and-shoulders neckline pattern. Driven by hotter-than-expected US Producer Price Index (PPI) figures, rising US Treasury yields, and a robust US Dollar rebound, spot silver tumbled over $3.60 in recent trading sessions. Live market pricing places silver near $64.16, marking a 5.57% single-session decline on heavy trading volume that reached nearly 14 times its 20-day average. The technical breakdown has brought key psychological support levels into clear focus, leaving market participants watching for confirmation of a daily close to validate the chart pattern's bearish projection.
Technical Landscape: Head-and-Shoulders Neckline Breach and Key Support Zones
From a technical perspective, silver's slide through its head-and-shoulders neckline represents a crucial chart development. While the intraday drop past this structural threshold highlights mounting selling momentum, technical analysts emphasize that a confirmed daily close below the neckline is essential to solidify the bearish pattern. Should sellers successfully hold prices beneath this line, the immediate technical focus shifts toward the major psychological milestone at $60.00. A decisive breakdown past $60.00 would open the path toward the full head-and-shoulders pattern target located near $55.00.
Live trading technicals reflect this emerging bearish structure across multiple indicators. The relative strength index (RSI) currently sits at 47, indicating neutral to weakening momentum. Moving average convergence divergence (MACD) shows a bearish crossover with the main line at 0.78 below the signal line of 1.17, producing a histogram reading of -0.39. Additionally, moving averages display a long-term downtrend structure, characterized by a death cross alignment where the 50-day exponential moving average ($65.07) sits below the 200-day exponential moving average ($66.04). Silver is currently positioned near the lower bound of its Bollinger bands ($63.19 to $69.99), with immediate pivot support identified at $62.61 (S1) and secondary support at $61.06 (S2).
On the upside, any recovery attempt faces substantial technical hurdles. Initial significant resistance rests at the $60.00 to $67.15 (R1) region, followed by a heavier resistance zone at $70.00. A sustained bullish push beyond $70.00 would encounter the 200-day simple moving average (SMA) near $72.14 to $73.00, which serves as a major gateway for buyers aiming to reclaim the $75.00 level. Traders are paying close attention to daily pivot points around $65.60 to gauge whether short-term stabilization can occur before testing lower support boundaries.
Macroeconomic Factors: Inflation Spikes and Monetary Policy Expectations
The catalyst behind the precious metal market slide stems from macro economic releases in the United States. A hotter-than-projected Producer Price Index (PPI) report reinforced market expectations that inflation at the factory level remains sticky. Strong factory-gate pricing figures sparked an immediate repricing in fixed-income and currency markets, fueling expectations that the Federal Reserve may maintain higher interest rates for longer or even keep hawkish policy options on the table.
As a non-yielding asset, silver is particularly sensitive to changes in benchmark interest rates and US Treasury yields. When yields rise across the curve, the opportunity cost of holding non-yielding precious metals increases, causing institutional capital to reallocate toward yield-bearing assets. Concurrently, the US Dollar experienced a strong resurgence in response to the inflation data. Because international silver is priced in US Dollars (XAG/USD), a stronger greenback makes the metal relatively more expensive for foreign currency holders, exerting persistent downward pressure on spot market valuations.
Cross-Asset Movements: Gold, Australian Dollar, and Japanese Yen Dynamics
Silver's technical selloff did not occur in isolation, as related currency and precious metal markets reflected similar volatility. Gold experienced choppy trading behavior, slipping back toward the $4,350 per troy ounce region. The pullback in gold prices came alongside the broader bounce in the US Dollar and climbing Treasury yields, as market participants prepared for upcoming Consumer Price Index (CPI) releases to gauge the full path of US inflation.
In foreign exchange markets, the Australian Dollar (AUD/USD) faced renewed selling pressure, drifting back toward multi-day lows near 0.7150 where temporary support emerged. The Aussie's decline directly reflected the greenback's inflation-driven rally following the US factory-gate price report. Meanwhile, the Japanese Yen demonstrated relative resilience, with USD/JPY stabilizing above 153.50. Hawkish repricing around the Bank of Japan continued to underpin the Yen, keeping the currency pair near multi-month lows even as rising September Federal Reserve rate expectations and geopolitical tensions provided underlying support to the US Dollar.
Fundamental Foundations: Industrial Utility, Safe-Haven Demand, and Valuation Ratios
Understanding silver's market behavior requires examining its unique dual identity as both a store of value and a vital industrial raw material. While silver shares safe-haven characteristics with gold, offering portfolio diversification and inflation hedging during periods of economic uncertainty, its market dynamics are heavily influenced by physical supply and industrial demand. Silver possesses the highest electrical conductivity of all metals, outperforming copper and gold, making it an indispensable component in advanced electronics, automotive technologies, and expanding solar energy manufacturing.
Industrial demand patterns in key global economies play a vital role in determining long-term price trends. In the United States and China, large industrial sectors utilize silver across extensive manufacturing processes, where economic expansion or contraction directly impacts physical metal consumption. In India, consumer demand for silver jewellery, decorative items, and physical bullion represents a major structural pillar supporting global price dynamics, particularly during major cultural and festival seasons.
Investor sentiment is also guided by the historical relationship between gold and silver. Silver prices historically track gold's directional trends, albeit with higher volatility due to market size and supply factors—as silver mining production is significantly more abundant than gold. Financial analysts closely monitor the Gold/Silver ratio, which measures the number of silver ounces required to equal the value of one ounce of gold. A high Gold/Silver ratio often signals to value-oriented investors that silver may be historically undervalued relative to gold, whereas a low ratio suggests relative overvaluation, serving as a tactical compass for asset allocation strategies.