






















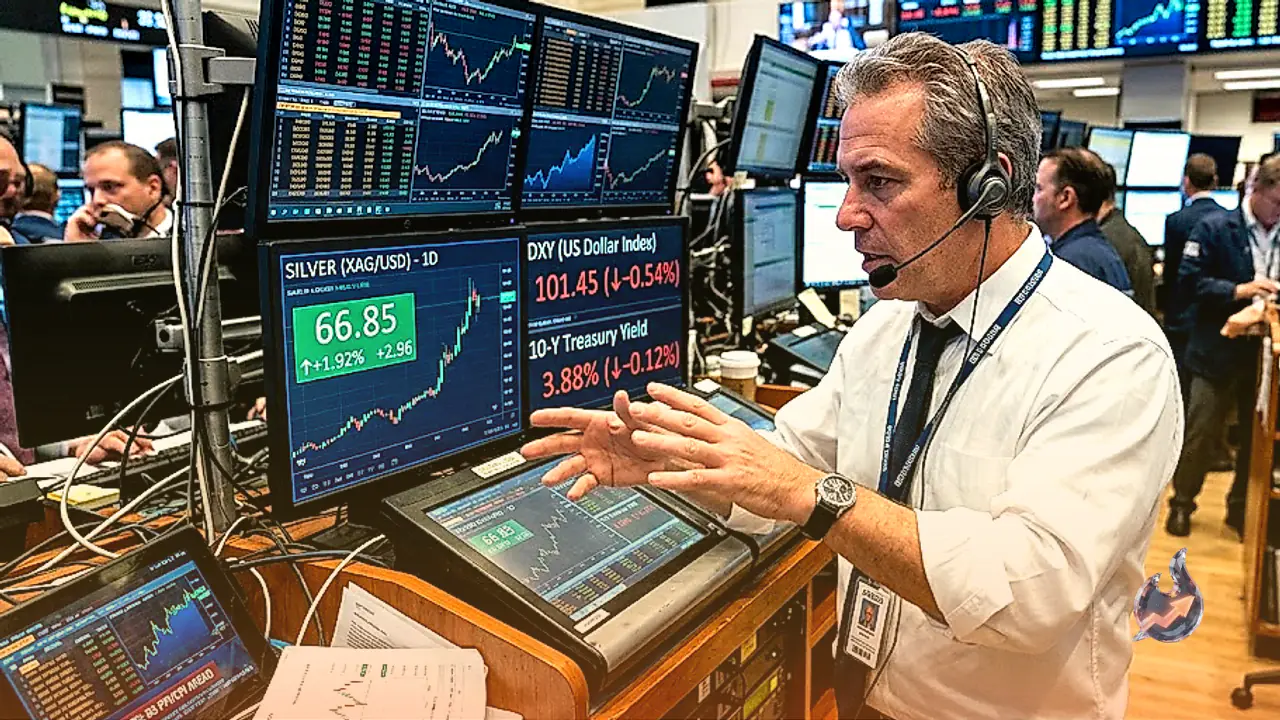

Precious metals markets are seeing notable movement, with silver capitalising on a lower US Dollar and softer US Treasury Yields. During the Asian trading session, silver, traded as XAG/USD, recorded a 1.25% increase, hovering near the $67.00 mark. The white metal has drawn strength as the US Dollar and US bond yields face downward pressure, while market participants turn their attention squarely toward the upcoming Consumer Price Index data for August, scheduled for release on Friday.
US Dollar Index and Treasury Yield Performance
At the time of writing, the US Dollar Index, which measures the greenback against a basket of six major currencies, trades down by 0.1% near 98.83, even after managing a modest recovery from its earlier losses. Meanwhile, the 10-year US Treasury Yields have slipped 0.17% to trade near 4.77%. The concurrent retreat in both the dollar and bond yields has provided a favourable environment for silver prices to advance.
Inflation Expectations and Analyst Projections
According to forecasts from TD Securities, the upcoming August CPI report is expected to show that underlying inflation remained contained, with core prices projected to rise 0.19% month-on-month and 2.3% year-on-year. The institution anticipates that the services sector will act as the primary driver behind these gains, whereas core goods prices likely served as a drag by registering a modest monthly drop.
Conversely, analysts look for headline CPI to print a stronger 0.37% month-on-month and 3.4% year-on-year increase, largely driven by rising energy costs and a slight uptick in food inflation. The bank has also cautioned that risks to its projections remain skewed to the upside, noting that their forecasting models assume several large price reductions in tariff-exposed goods categories, such as apparel and household items. Ahead of the consumer inflation figures, investors will also digest the Producer Price Index data for August, due out on Thursday.
Live market data shows silver (SI=F) trading at $67.64, with the previous close at $66.05, marking a 2.41% gain. The asset's 52-week range spans from $40.88 to $121.30, accompanied by a trading volume running at 7.72x the 20-day average.
Technical Outlook and Indicator Analysis
On the daily chart, XAG/USD is holding a constructive near-term bias as prices remain positioned above the nine-day Exponential Moving Average at $66.49. This technical positioning indicates that the recent pullback is finding sustained support rather than triggering a broader trend reversal. The Relative Strength Index, situated around 57, maintains a mildly positive tone, suggesting that underlying bullish momentum remains intact without pushing into overbought territory.
On the downside, initial support aligns with the nine-day EMA at $66.49, where a decisive daily close below could point toward a deeper consolidation phase. Looking upward, the August swing high at $71.12 is expected to serve as a formidable hurdle for buyers.
Additional technical indicators show the MACD reading at 1.10 compared to the signal line at 1.35, resulting in a histogram of -0.25, reflecting a mild bearish crossover context within a broader trend. Moving averages highlight that the EMA20 is at $65.85, the EMA50 at $65.04, and the EMA200 at $65.83, while the SMA50 sits at $62.16 and the SMA200 at $71.99, confirming a long-term uptrend alongside a death cross formation where the EMA50 trades below the EMA200. Bollinger Bands are charted between $63.23 and $69.89 with a middle band at $66.56, placing prices comfortably inside the bands. The ADX reading of 22 indicates a weak or range-bound trend strength, while the Stochastic oscillator displays a fast line at 56 and a signal line at 47. The Average True Range (ATR) stands at 1.93, providing a helpful volatility buffer for stop-loss positioning.
Key Trading Levels
For traders monitoring immediate levels, the daily pivot is established at $67.17. Resistance levels are pegged at R1 ($68.31) and R2 ($68.98), while immediate support rests at S1 ($66.50) followed by S2 ($65.36). The broader 52-week parameters remain anchored between $40.88 and $121.30.
Broader Market Dynamics for Silver
Silver has historically served as both an industrial input and a store of value. While less dominant than gold as a safe-haven asset, traders frequently utilise silver for portfolio diversification, intrinsic value preservation, or as an inflation hedge. Market participants can gain exposure through physical holdings such as coins and bars, or via financial instruments like Exchange Traded Funds that track international market prices.
Price movements in silver are driven by various macroeconomic factors, including geopolitical tensions and economic outlooks. Because silver is priced in US dollars, currency fluctuations play a crucial role; a weaker dollar generally boosts silver prices, whereas a strengthening dollar tends to cap gains. Furthermore, industrial demand remains vital, particularly from sectors like electronics and solar energy, given silver's superior electrical conductivity compared to copper and gold. Economic trends in major economies such as the United States, China, and India also heavily influence physical consumption and industrial demand.