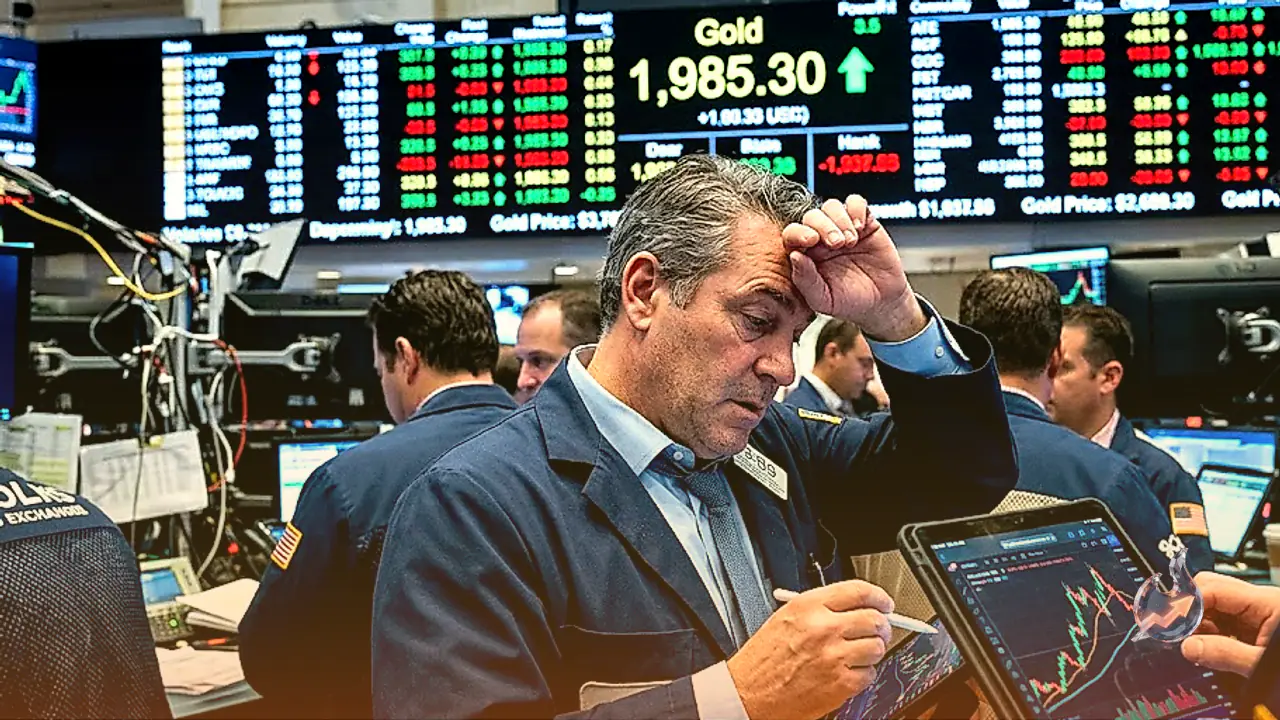

























Silver extended its correction on Tuesday, dropping 1.43 percent as market participants reduced their exposure ahead of the upcoming United States inflation data. The precious metal traded around the 67.50 dollar mark during the session, marking its second consecutive day of pullback as attention increasingly shifts toward the Personal Consumption Expenditures (PCE) Price Index release and the Jackson Hole Symposium.
PCE Inflation Data and Federal Reserve Outlook
Core PCE inflation, which serves as the Federal Reserve’s preferred gauge for assessing price pressures, is widely anticipated to hold steady at 3.4 percent year-on-year for the month of July. A reading that comes in stronger than anticipated could spark renewed apprehensions regarding a tighter monetary policy stance, thereby weighing heavily on silver prices. Conversely, any cooling in inflation metrics might reinforce expectations of a policy hold, offering renewed momentum to precious metals. Meanwhile, market participants are also closely evaluating signals emanating from the domestic labor market, where the four-week moving average for ADP Employment Change climbed to 11.75 thousand jobs per week in early August compared to 9.5 thousand previously, pointing toward a modest recovery in private-sector hiring even as broader economic trajectories remain under scrutiny.
Technical Indicators and Hourly Chart Configurations
On the one-hour chart, XAG/USD is changing hands near 67.92 dollars, maintaining a capped near-term profile as prices remain positioned beneath the 100-hour Simple Moving Average situated around 68.01 dollars while holding above the 200-hour SMA near 66.40 dollars. This structural configuration, characterized by overhead short-term resistance and foundational long-term support, underscores an ongoing consolidation phase within a larger upward trend. Furthermore, the Relative Strength Index hovering around 44.00 signals subdued bullish momentum, leaving the metal susceptible to further corrective declines should current support levels fail to hold.
Key Support and Resistance Levels
Looking toward the upside, initial resistance lines up near the 100-hour SMA at 68.01 dollars, followed by a horizontal barrier at 68.50 dollars and a more elevated threshold near 70.00 dollars. On the downside, immediate support emerges around the 67.50 dollar region, with deeper cushions located at 66.50 dollars and the nearby 200-hour SMA clustered at 66.40 dollars, a breach of which would likely tilt market bias decisively in favor of sellers.
Broader Financial Markets and Currency Movements
Across the broader financial landscape, other major assets experienced notable movements on Tuesday. GBP/USD maintained its consolidation phase for a second consecutive session, hovering in a tight band above the 1.3600 threshold as the US dollar stabilized amid assessments of sanctions on Iran and renewed diplomatic efforts involving Pakistan. Simultaneously, EUR/USD struggled to muster recovery momentum, trading beneath 1.1700 during the latter half of the day while benefiting from a cautious market sentiment driven by Middle Eastern developments and soft US consumer sentiment readings. Gold (XAU/USD) pared its intraday gains during American trading hours after briefly touching a fresh three-month high of 4,697 dollars earlier in the day. In the digital asset space, Bitcoin (BTC) continued trading above 80,000 dollars, hitting its highest level since mid-May and reflecting an upbeat shift in risk appetite, liquidity parameters, and technical structures.
Corporate Earnings and Treasury Liquidity Actions
The second-quarter corporate earnings season for S&P 500 members is drawing to a close with a largely positive reporting cycle, though attention remains fixed on artificial intelligence frontrunner NVIDIA (NVDA) ahead of its upcoming results. Additionally, the US Treasury implemented a notable adjustment to its operational calendar by announcing a doubling of liquidity support buyback sizes across the 10-year to 20-year and 20-year to 30-year sectors, raising the maximum cap from 2 billion dollars to at least 4 billion dollars per operation, effective from September 9 through November 4.