






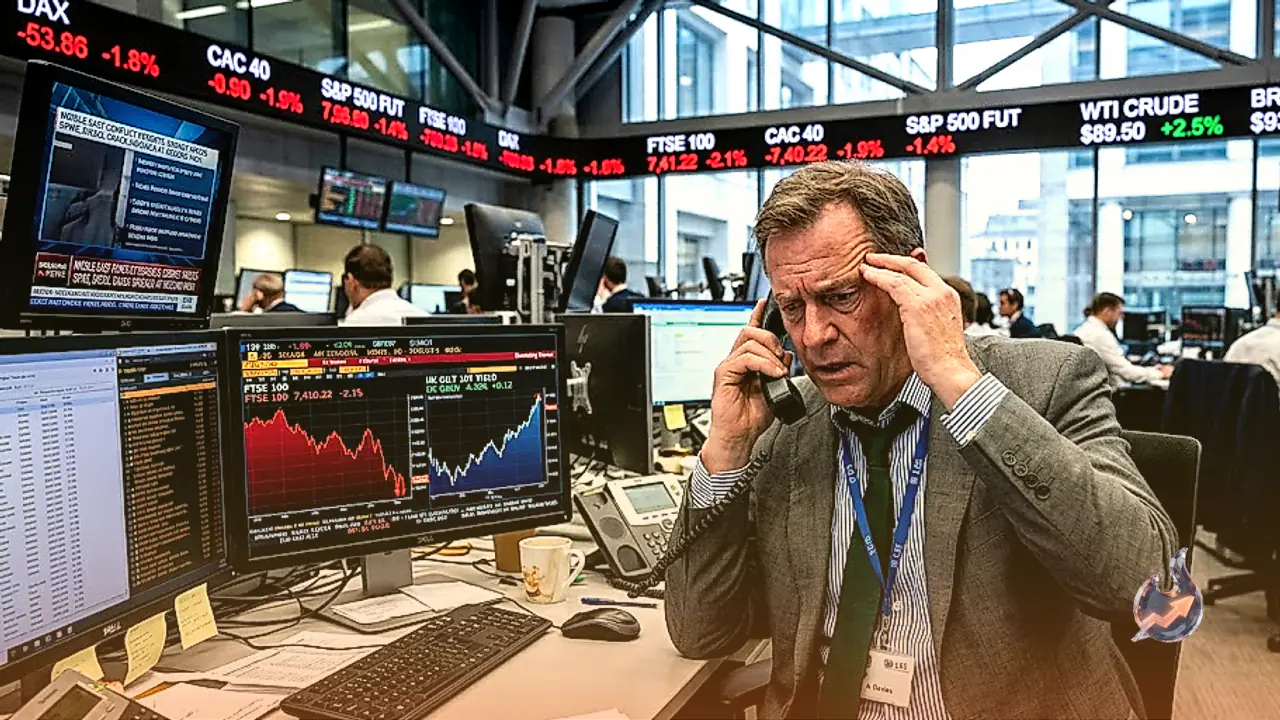


















The US stock market extended its selling pressure for the second consecutive session on September 1st, marking a bearish start to the new month. The Dow Jones is currently struggling below the 53,000 mark, while the tech-heavy Nasdaq hovers around 26,250. Meanwhile, the S&P 500 index is attempting to stay above the 7,650 zone. Historically, September has been the weakest month for all three major indices. Driven by prolonged geopolitical impacts on the global economy, sticky inflation, and tightened monetary policy, the US stock market is confronting stronger Treasury yields and elevated oil prices.
Historical Performance of September on Wall Street
Over the past 25 years, September has generally been bearish for the US stock market. The 25-year average performance shows that September is weakest for the Nasdaq with a 1.33% downside, followed by the S&P 500 with a 1.16% decline, and the Dow Jones with a 1.09% drop. In the past 25 years, the Dow Jones has recorded 12 positive Septembers and 13 negative ones, whereas the S&P 500 has seen 13 positive and 12 negative Septembers. The Nasdaq has experienced an equal split of 12 positive and 12 negative Septembers with flat movement otherwise.
Best and Worst Septembers Over the Years
The best September for Wall Street occurred in 2010, 15 years ago, when the Dow Jones rose 7.7%, the S&P 500 gained 8.8%, and the Nasdaq outperformed with a 12% upside. Conversely, the worst Septembers were recorded in 2001 and 2002. The Nasdaq suffered its worst September in 2001, crashing by 17%, followed by another 11% decline in 2002. For the Dow Jones and S&P 500, the worst September happened in 2002, plunging 12.4% and 11% respectively. The most recent bearish Septembers faced by these indices occurred between 2020 and 2023 during the Covid-19 pandemic.
Insights From Macrobond Economic Data
Denys Liutyi, an economic expert at Macrobond, explains that analyzing long-term average returns by calendar month reveals September as a distinct outlier. He notes that September's average return is negative, falling below -1% across the historical sample. Because simple arithmetic averages can be skewed by unusually bad years, Liutyi suggests examining median returns and trimmed means, which yield the same negative result for September. Comprehensive data from Macrobond reveals that September is by far the worst month for global markets as well, affecting indices such as the MSCI World, S&P 500, Russell 2000, DAX 40, FTSE 100, and Nikkei 225.
Examining the Origins of the September Effect
Despite decades of research, experts acknowledge that there is no definitive consensus explaining why the September effect exists. It may simply be a persistent market myth reinforced by repetition. One common theory links it to the mutual fund fiscal year, which historically ended on October 31 for many US funds, prompting managers to sell losing positions in September to tidy up portfolios. However, similar patterns appear in international markets with entirely different fiscal calendars, suggesting a broader seasonal behavioral trend.
Strategy and Outlook From Citadel Securities
Scott Rubner, Head of Equity and Equity Derivatives Strategy at Citadel Securities, maintains a constructive long-term view on US equities but notes a shift in the near-term risk and reward setup. Following the July reset, the S&P 500 rallied approximately 22% and added $12 trillion in market capitalization in five months. However, Rubner explains that the earnings tailwind is largely behind us just as the calendar returns to macro factors. With retail and corporate demand historically fading through September, volatility compressed, and downside protection inexpensive, he views September as a tactical downside window rather than the start of a broader bearish turn.
Recent Market Performance
In recent trading, the Dow Jones dropped 427.36 points or 0.80% to trade around 52,758.54. The Nasdaq Composite plunged 236.82 points or 0.90% to hover near 26,134.07, while the S&P 500 declined 52.20 points or 0.7% to 7,633.94. For the entire month of August, all major indices finished in the green, led by the Nasdaq with a 1.8% gain, while the S&P 500 rose 1.13% and the Dow Jones edged up 0.01%.