
























Sellers dominated the European single currency at the start of the week, driving the EUR/USD exchange rate down by 0.42 percent to finish near 1.1550. The drop pushed the currency pair below both its 50-day and 200-day Exponential Moving Averages (EMA) for the first time since late July. Because the two reference lines were sitting a mere two pips apart on the technical charts, the pair breached them virtually simultaneously. The US Dollar advanced against every major global peer during the trading session, reflecting broad strength across foreign exchange desks as policy expectations shifted sharply.
The catalyst behind the greenback's advance was the total repricing of near-term borrowing costs in the United States. Futures contracts linked to the Federal Reserve's policy rate closed Monday pricing a 100 percent certainty of a quarter-point rate increase on Wednesday. If delivered, the move would represent the first American policy rate hike since 2023. The development stands in contrast to the European Central Bank (ECB), which raised its own policy settings last Thursday, only to see the Euro weaken in every single trading session that followed.
The European Central Bank's Faulty Crude Assumptions
The European Central Bank lifted its deposit rate, the benchmark interest paid to commercial banks for parking cash overnight, to 2.50 percent on September 10. The move represented the governing council's second rate increase of the calendar year and passed with unanimous backing. In its official policy statement, the institution warned that headline inflation would linger well above its target for an extended duration. Accompanying staff projections estimated consumer price growth peaking at 3.6 percent in the final quarter of the year before cooling to 2.5 percent by mid-next year.
However, the economic foundation underneath the central bank's inflation glidepath relied on an energy baseline locked in on August 19. That baseline assumed Brent crude oil would average $88 per barrel in the current quarter and retreat to $78 per barrel next year. Energy markets have moved against that scenario: Brent crude has traded above $100 per barrel since the week the forecast was released, climbing past $105 per barrel on Monday. This gap undermines the core assumptions supporting the bank's medium-term forecasts.
Energy Invoices and the Widening Transatlantic Policy Gap
For foreign exchange markets, the oil price discrepancy carries greater weight than the headline interest rate increase itself. The European economy imports virtually all the crude oil it consumes, and these international energy transactions must be settled in US Dollars. Every $10 rise in the cost of a barrel translates into institutional selling of Euros to acquire the Dollars required to clear incoming delivery invoices, long before monetary policy adjustments take effect. The ECB staff model had pegged the Euro at 1.16 against the greenback through 2028, but Monday's market close sat half a cent below that baseline.
Concurrently, interest rate derivatives are projecting a sustained tightening cycle in the United States. Federal Reserve interest rate futures anticipate Wednesday's move lifting the target corridor to between 3.75 percent and 4.00 percent, with an additional increase priced by December and rates hovering near 4.55 percent by next July. That trajectory sits almost a full percentage point above current borrowing costs. Meanwhile, futures indicate a 78 percent chance of an ECB rate increase on October 29, bringing its deposit facility to roughly 3.40 percent by September of next year. While both institutions have roughly three to four hikes priced over the coming year, leaving the policy spread roughly stable at current levels plus four basis points, energy demand creates an asymmetric dollar bid.
Treasury Yields Spike as Central Bank Calendars Align
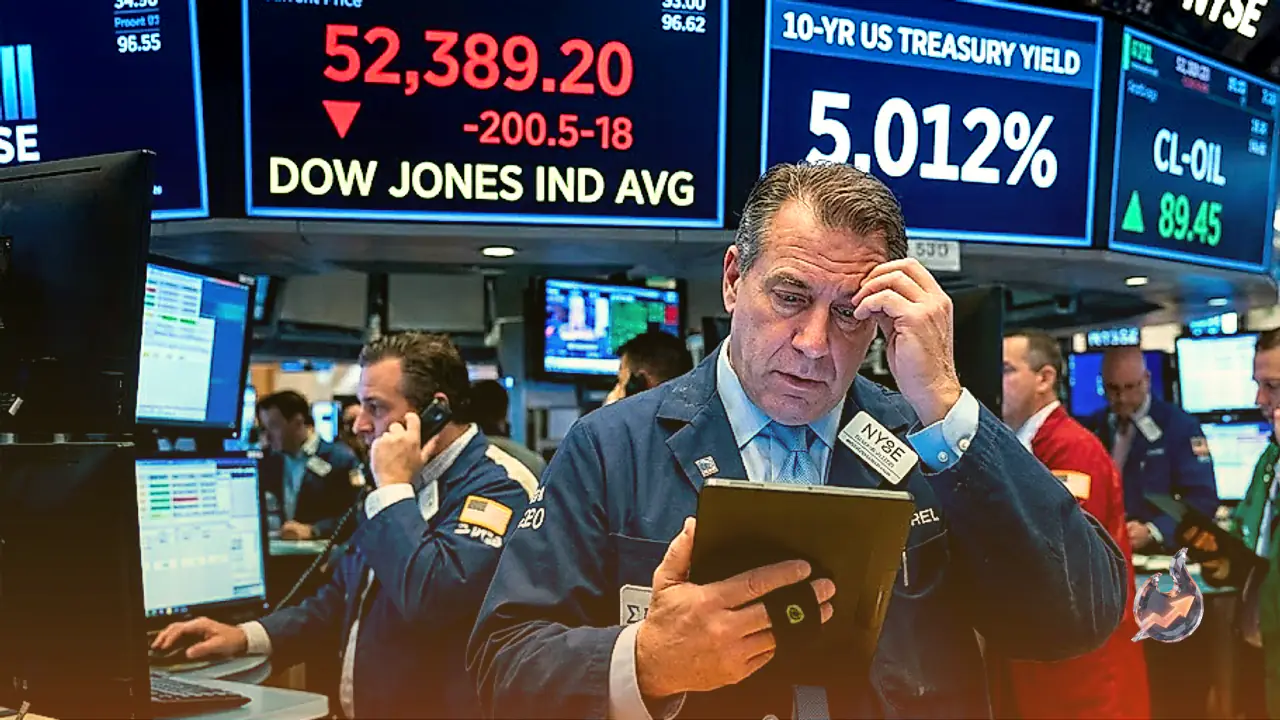
The divergence was exacerbated by a sell-off in sovereign debt markets. The yield on the benchmark 10-year US Treasury bond touched 5 percent for the first time since 2023, while crude oil held at a four-month peak throughout the European trading window. Because both commodities and Treasury securities trade in American currency, foreign buyers must purchase greenbacks, intensifying pressure on the Euro on days when broader macroeconomic factors already favor dollar assets. While the Fed's June summary of economic projections guided toward a terminal rate of 3.8 percent this year and 3.6 percent next year, current trading prices in nearly a full percentage point more for 2027 than policymakers wrote down three months ago. Wednesday's updated dot plot will determine whether policy guidance confirms or challenges market pricing.
Traders face an eventful economic calendar throughout the remainder of the week. Tuesday begins with the release of the German ZEW survey of financial market analysts at 09:00 GMT, which is expected to improve to 39.9 from 31.4, alongside a scheduled speech from an ECB executive board member at 14:00 GMT. Wednesday's morning session brings Eurozone industrial production figures at 09:00 GMT, anticipated to decline 0.4 percent in July following a flat June reading. Attention then turns to American retail sales data at 12:30 GMT, projected to rebound 0.9 percent in August following a 0.6 percent contraction. Higher gasoline prices in August may inflate the nominal retail figure, meaning policymakers will focus intently on the control group metric, which strips out volatile components like vehicle purchases, building materials, and retail gasoline, before voting five and a half hours later.
Central bank communication reaches a climax late Wednesday: the ECB president speaks at 17:00 GMT, the Federal Reserve delivers its policy decision at 18:00 GMT, and the Fed chair begins the press conference at 18:30 GMT. On Thursday, the ECB's chief economist delivers remarks at 07:00 GMT, followed by the final August inflation prints for the Eurozone at 09:00 GMT, with core consumer prices projected to remain steady at 2.4 percent. Notably, the ECB rate hike decided during the previous week takes formal effect on Wednesday, September 16, coinciding directly with the Fed's policy vote.
Technical Chart Structure and Price Targets
From a charting perspective, the moving average convergence near 1.1570 now establishes immediate technical resistance. That level represents the upper boundary that capped price action on Monday. Above that threshold sits 1.1600, a key consolidation marker where the pair traded for two weeks prior to slipping beneath it on Friday. Further upside would face resistance near the September peak just shy of 1.1650.
On the downside, Monday's intraday trough just above 1.1500 offers preliminary support, followed by the early-August structural floor at 1.1500 flat. A sustained breakdown below that base would bring the 1.1450 zone into focus as the next downside objective. Technical momentum remains soft, with the daily Stochastic Relative Strength Index (Stoch RSI) pointing downward near 18, indicating an oversold yet persistent downward trend. The short-term bearish bias remains intact while prices stay capped beneath 1.1600, with a daily close above that pivot required to invalidate the setup.
Current live market figures show EUR/USD trading around 1.15 within a 52-week band of 1.13 to 1.20. Live technical indicators register the 14-day RSI at 37, MACD displaying negative momentum, and the 50-day and 200-day moving averages converged around 1.16 in a death cross formation. The 20-day Bollinger Bands span from 1.15 to 1.17, while the daily Average True Range (ATR) sits at 0.01. Key trading pivots are aligned at 1.15, with primary support sitting between 1.15 and 1.14.
Structural Drivers: Central Bank Mandates and Economic Indicators
The Euro serves as the legal tender for 20 member states of the European Union that comprise the Eurozone. It holds the rank of the world's second most traded currency, trailing only the US Dollar. In 2022, the Euro represented 31 percent of all foreign exchange volumes globally, generating an average daily turnover exceeding $2.2 trillion. The EUR/USD pair is the single most liquid foreign exchange instrument, responsible for approximately 30 percent of total market turnover, followed by EUR/JPY at 4 percent, EUR/GBP at 3 percent, and EUR/AUD at 2 percent.
Monetary policy is governed by the European Central Bank located in Frankfurt, Germany. Its core objective is safeguarding price stability across member states. The bank alters official interest rates to either suppress rising inflation or encourage economic expansion. Higher benchmark rates typically increase currency appeal by offering international funds higher yields on capital deposits. Policy decisions are finalized eight times annually by the Governing Council, composed of eurozone national central bank governors and six permanent executive members, including President Christine Lagarde.
Economic data heavily dictate currency valuation. Inflation measured through the Harmonized Index of Consumer Prices (HICP) serves as a primary benchmark; upside surprises relative to the 2 percent target force policy tightening. Key metrics such as Gross Domestic Product, manufacturing and service purchasing managers indexes (PMIs), labor market numbers, and sentiment gauges all drive capital flows. Output figures from Germany, France, Italy, and Spain are especially critical because these four economies generate 75 percent of Eurozone gross product. Furthermore, the external trade balance dictates commercial foreign exchange demand: nations exporting high-demand goods generate persistent bidding for their local currency, whereas widening import bills exert sustained downward pressure.
Spillover Across Global Currencies, Gold, and Digital Assets
The dollar's upward momentum created headwinds across foreign exchange and commodity assets. The Australian Dollar traded lower on Monday, testing the 0.7100 handle before recovering toward 0.7150 prior to Asian trading. Expectations surrounding American monetary policy pushed the Aussie toward monthly lows as market participants awaited incoming economic data releases from China.
The USD/JPY pair found buying interest at the start of the week, rising toward 154.00 during the Asian session and erasing portions of its Friday declines. Despite the uptick, spot prices remained bound within a narrow weekly trading channel near the seven-month low established on the previous Tuesday. In precious metals, spot gold rallied to test the $4,300 per troy ounce threshold on Monday, though overall upside progress remained constrained by elevated US Treasury yields and broad dollar strength.
In digital asset markets, JasmyCoin displayed tentative stabilization, trading between horizontal support at $0.0035 and resistance near $0.0040. The token has experienced sustained technical weakness since May, retreating from earlier highs around $0.0078 as sellers maintain control over directional momentum. Across broader markets, elevated Producer Price Index and Consumer Price Index reports have fortified expectations for Federal Reserve policy tightening. The central bank's institutional independence remains under scrutiny alongside public comments from Donald Trump advocating lower borrowing costs, leaving the greenback's near-term path tied directly to upcoming policy statements.