























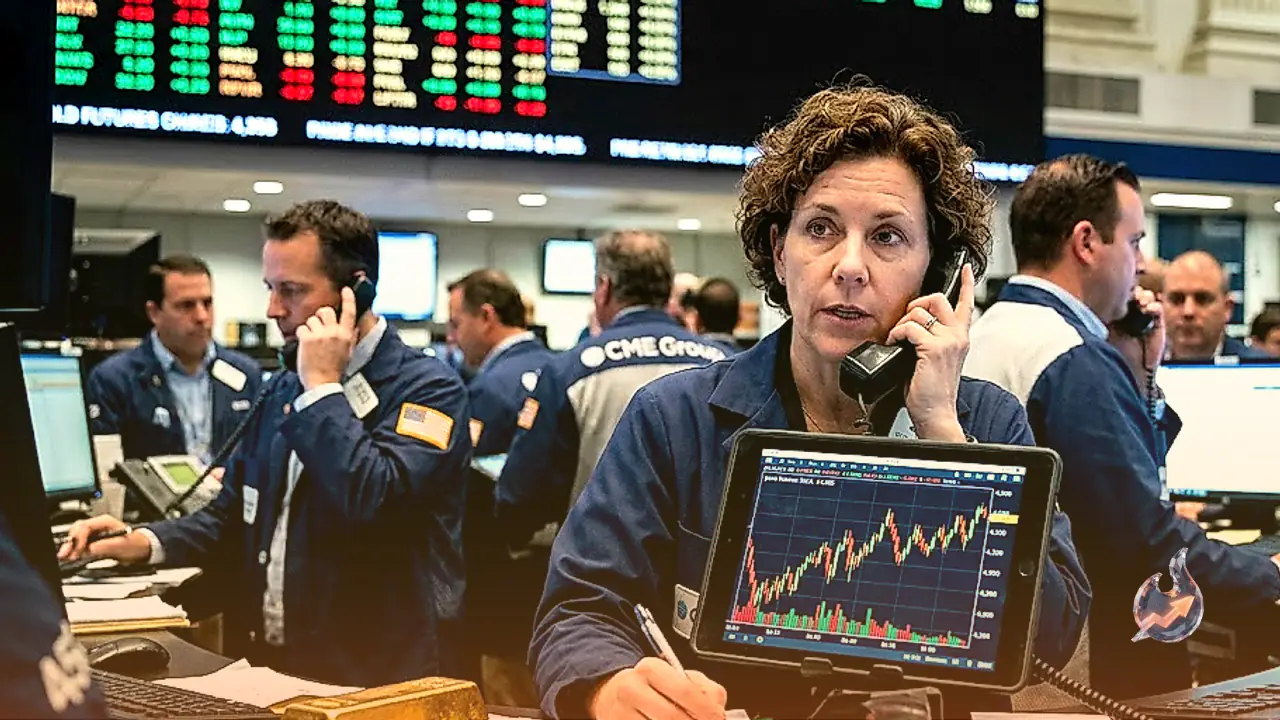

Gold prices have exhibited a notable recovery, stabilizing around the $4,358 mark as intense selling pressure from the energy sector begins to moderate. The aggressive rally in global crude oil prices has started to cool down, offering a much-needed breathing space for the precious metal, which had previously been trading under significant pressure. Despite this modest intraday ascent, any potential upside for gold remains strictly capped. The broader financial markets are still grappling with the hawkish policy stance of major global central banks, particularly the Federal Reserve, which continues to signal that borrowing costs must remain elevated for an extended period. With the daily market closing at $4,358, registering a decline of 0.68% on the day from its previous close of $4,388, the ongoing tug-of-war between gold's safe-haven appeal and rising interest rates continues to dominate investor sentiment.
The Federal Reserve's Monetary Policy Trajectory and Market Pricing
On Wednesday, the Federal Reserve took the step of hiking its benchmark interest rates yet again. More importantly for long-term expectations, a clear majority of policymakers signaled that at least one more rate hike remains on the table before the end of this year. According to market strategists, this persistent hawkish stance has caused a profound realignment across the front end of the US yield curve. Money markets have rapidly adjusted to price in a much tighter monetary environment. Specifically, investors are now fully pricing in another 75 basis points of Fed rate hikes by next June, an adjustment that saw a 10.8 basis points surge on the day. Furthermore, market pricing suggests there is a 50% probability of another rate hike occurring as early as the upcoming October meeting. This relentless upward pressure on interest rates presents a severe headwind for gold. As a non-yielding asset, gold does not offer regular dividend or interest payments, meaning its opportunity cost rises significantly when interest rates on safe government bonds ascend.
The Crude Oil Connection & Oman Transfers
One of the major catalysts behind the shifting dynamic in gold has been the recent cooling of crude oil markets. Industry reports indicate that Saudi Arabia has actively worked to supply additional crude oil cargoes to Asian refining firms. This is being executed through complex ship-to-ship transfers positioned off the Sohar port in Oman. The stabilization of crude prices is directly connected to gold due to the historical relationship between energy costs and inflation. High oil prices have a cascading effect on global economies, drastically inflating production and transport costs. This de-anchors inflation expectations, forcing global central banks to adopt aggressive monetary tightening policies, including sharp interest rate hikes, to bring prices under control. Since higher interest rates make gold less attractive, any rise in energy costs indirectly harms the precious metal. Conversely, when oil rallies cool off, the immediate panic regarding uncontrolled inflation and further interest rate hikes subsides, allowing gold to find temporary support.
Technical Landscape: Key Levels, Moving Averages, and Oscillators
Analyzing the daily chart of XAU/USD reveals a highly nuanced technical setup. The precious metal closed its latest session at $4,358, maintaining a tight trading range within its broader 52-week boundaries of $3,661 to $5,586. The daily volume was noted at 0.40x the 20-day average. From a technical perspective, gold has been navigating a long-term downtrend, characterized by a bearish "death cross" pattern where the 50-day exponential moving average (EMA50) at $4,390 has crossed below the 200-day exponential moving average (EMA200) at $4,419.
The current price of $4,358 remains below the 20-day exponential moving average (EMA20), which stands at $4,426, establishing a strong dynamic resistance level. In earlier sessions, gold had hovered around the $4,314.02 level, struggling underneath its historical 20-day EMA of $4,364.99. The Relative Strength Index (RSI) is currently calculated at 45, falling slightly below the neutral threshold of 50. This indicates a general lack of upward momentum rather than oversold territory. The Moving Average Convergence Divergence (MACD) indicator is also reflecting bearish sentiments, registering at -5.17 against a signal line of 24.00, resulting in a negative histogram of -29.17.
When looking at critical technical thresholds, the daily pivot point is established at $4,342. Immediate resistance levels to watch on the upside include Resistance 1 (R1) at $4,390, followed by Resistance 2 (R2) at $4,422. Key historical resistance points include the September 8 peak near $4,443. On the downside, the first major support level (S1) is marked at $4,310, with deeper support (S2) positioned at $4,262. A breach of these zones could expose gold to the psychological level of $4,000, especially if it breaks past the prior Wednesday low of $4,235.40. The average true range (ATR) currently sits at 109.28, representing daily volatility, which traders often use to establish their stop-loss buffers. The 20-day support is roughly around $4,273, while resistance is capped near $4,755.
The Sovereign Power of Gold as a Safe Haven
Throughout human civilization, gold has occupied a unique structural position. It has served as a reliable store of value and a universal medium of exchange across centuries. Today, while it remains highly valued for its aesthetic brilliance and application in fine jewelry, its primary appeal to institutional investors lies in its role as a premier safe-haven asset. During periods of geopolitical crises, trade conflicts, or deep economic recessions, capital routinely flees risky equities and flows into gold. Because gold does not depend on any specific national issuer or government, it is immune to the fiscal mismanagement that can lead to the depreciation of fiat currencies. Consequently, it is widely utilized as an effective hedge against inflation and currency devaluation.
Central Bank Reserves and Buying Patterns
Central banks around the globe are the largest and most influential holders of gold reserves. To maintain stability during times of intense economic turbulence, these institutions actively diversify their reserves. By purchasing gold, they enhance the perceived strength of their domestic economies and protect their national currencies from sudden shocks. Massive gold reserves serve as a visual signal of a nation's solvency, inspiring trust among global investors. According to detailed data compiled by the World Gold Council, central banks made unprecedented moves in 2022, acquiring an astounding 1,136 tonnes of gold. This massive purchasing spree, valued at roughly $70 billion, marked the highest annual volume of central bank gold buying since records began. This aggressive accumulation has been led predominantly by the central banks of emerging market economies, with nations like China, India, and Turkey quickly expanding their gold holdings to safeguard their financial systems.
The Matrix of Dollar Correlations and Global Currency Trends
Gold maintains a highly consistent inverse correlation with both the US Dollar and US Treasury yields, both of which serve as major global reserve and safe-haven assets. When the US Dollar depreciates, the cost of gold for foreign buyers decreases, driving up its demand. Conversely, when equity markets experience a robust rally, investors move out of safe-haven gold and back into high-risk, high-yield assets, putting downward pressure on the precious metal. This shifting dollar sentiment has had clear ripple effects across other global currency pairs.
In the Asian trading session, AUD/USD witnessed a wave of fresh buying interest, reclaiming the 0.7100 level. This movement occurred as the US Dollar paused its aggressive, Fed-fueled rally, which had previously pushed the greenback to its highest levels since late July. This recovery in the risk-sensitive Australian Dollar was further supported by rising expectations of interest rate hikes by the Reserve Bank of Australia (RBA) and growing market optimism surrounding diplomatic efforts between the United States and Iran.
Similarly, the USD/JPY pair reversed a brief dip below the 156.00 level during the Asian session, snapping a three-day winning streak that had previously pushed the pair to a two-week peak. While the US Dollar experienced a pause after reaching seven-week highs post-Fed, a more hawkish market repricing of the Bank of Japan's (BoJ) monetary policy normalization path provided significant support to the Japanese Yen. The Japanese central bank's ultra-low interest rates had financed trillions of dollars in global investments for over a decade, making the Yen a highly popular cheap funding source. With expectations mounting that the BoJ will tighten its monetary policy yet again, this long-standing financial dynamic is shifting.
Meanwhile, in the European session, gold managed to build on its intraday gains, moving further away from a near six-week low. This minor rebound was catalyzed by a pullback in US Treasury bond yields, which prompted some profit-taking in the US Dollar. Despite this temporary relief, the long-term outlook for gold remains restricted. The Federal Reserve's hawkish posture, combined with ongoing geopolitical tensions in the Middle East, continues to provide a structural floor for the US Dollar, thereby limiting any deep, sustained rally for non-yielding bullion.
The analyst behind this technical and fundamental research, Sagar Dua, has been actively involved with financial markets since 2014, specializing in advanced technical chart patterns and commodity market studies.