























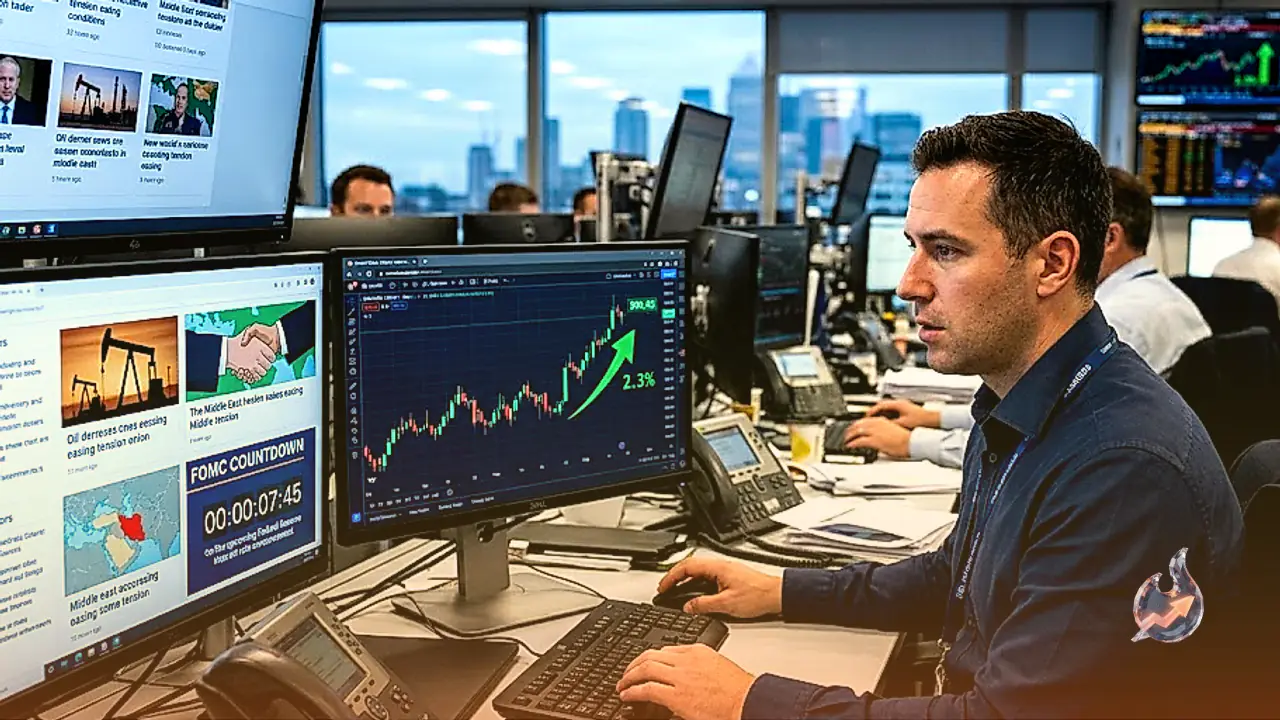

Precious metal markets kicked off the new trading week on a buoyant note, driven by shifting geopolitical conditions in the Middle East. Spot silver prices surged sharply during the Asian trading session on Monday, gaining more than 2% to approach the $60.00 per ounce threshold. The rally coincided with news of a pause in direct military aggression between the United States and Iran, an event that triggered a steep pullback in crude oil benchmarks and redirected capital flows into selected asset classes.
Diplomatic Developments and Federal Reserve Rate Expectations
As immediate military escalations show signs of cooling after five months of heightened hostilities, financial market participants are re-centering their attention on central bank actions and economic indicators. High on the priority list is the Federal Reserve's upcoming monetary policy announcement scheduled for Wednesday. Widely held market expectations suggest that the US central bank will opt to maintain benchmark interest rates at their existing levels.
Against this backdrop of interest rate stability and geopolitical recalibration, silver trading under the XAG/USD ticker has reached a pivotal technical position. The white metal is actively attempting to solidify its stance above the 20-day Exponential Moving Average, which sits around $59.35 to $59.70. Holding above this dynamic indicator is widely viewed by chart analysts as a necessary condition to reduce immediate overhead selling pressure.
Technical Analysis and Key Chart Levels for Silver
A closer look at the daily chart indicators reveals a gradual shift in market momentum. The 14-day Relative Strength Index is currently turning upward toward 48, signalling that bearish exhaustion is setting in and buying interest is slowly improving. A decisive daily close above the 20-day EMA at $59.35 would clear the path for a broader recovery in price action.
On the downside, technical support remains anchored around the July 17 low of $54.77. In terms of short-term intraday boundaries, the immediate resistance levels are identified at R1 $60.43 and R2 $60.91, while immediate support levels reside at S1 $59.43 and S2 $58.92. Over the broader 52-week horizon, silver has traded within a wide span ranging from a low of $36.35 to a high of $121.30.
Understanding Silver as a Financial and Investment Asset
Silver has held a historical role as both a store of value and a medium of exchange. While gold often occupies the headline position among precious metals, silver remains a popular instrument for investors seeking portfolio diversification, intrinsic value retention, or a hedge against persistent inflationary cycles. Participation in the silver market occurs through various channels, including physical bullion coins and bars, as well as Exchange Traded Funds that mirror spot international prices.
Because silver yields no ongoing interest, it benefits from lower interest rate environments where the opportunity cost of holding non-yielding assets decreases. Furthermore, its price trajectory is linked to the performance of the US Dollar, given that it is globally quoted in USD. A stronger greenback generally acts as a headwind for silver, whereas a softening dollar creates upward momentum. Factors such as recycling rates, mining supply—where silver is far more abundant than gold—and physical investment flows also govern overall price discovery.
Industrial Utility and Global Demand Drivers
Unlike gold, silver derives a massive portion of its fundamental demand from industrial applications. It possesses the highest electrical conductivity of any metal, outperforming both copper and gold, making it an essential component in modern electronics, circuit boards, and solar photovoltaic panels. Consequently, robust expansion in global industrial production routinely drives silver consumption upward.
Economic conditions across major global markets play distinct roles in determining silver demand. Industrial sectors in the United States and China consume vast quantities of the metal for manufacturing and green technology applications. Meanwhile, consumer demand in India, particularly for physical jewelry and traditional artifacts, provides a substantial structural base for global demand metrics.
Gold Comparison and the Gold-Silver Ratio
Silver prices frequently follow the broader price trends established by gold due to their shared status as safe-haven assets during times of global stress. Market participants track the Gold-Silver ratio—which measures how many ounces of silver are required to buy one ounce of gold—to evaluate relative value. A historically elevated ratio is often interpreted as silver being undervalued relative to gold, whereas a low ratio suggests gold may be trading at a discount to silver.
Across broader currency and financial markets, the week opened with notable cross-asset adjustments. Currency markets saw the GBP/USD pair advance past 1.3350, while EUR/USD reclaimed levels above 1.1400 on dollar weakness. Spot gold held its bullish opening gap near $4,100 per ounce. In cryptocurrency markets, Cardano (ADA) remained under pressure near $0.165 amid subdued derivatives metrics, while the Australian Dollar continued to navigate uncertainty linked to Middle East conflict developments and global interest rate expectations.