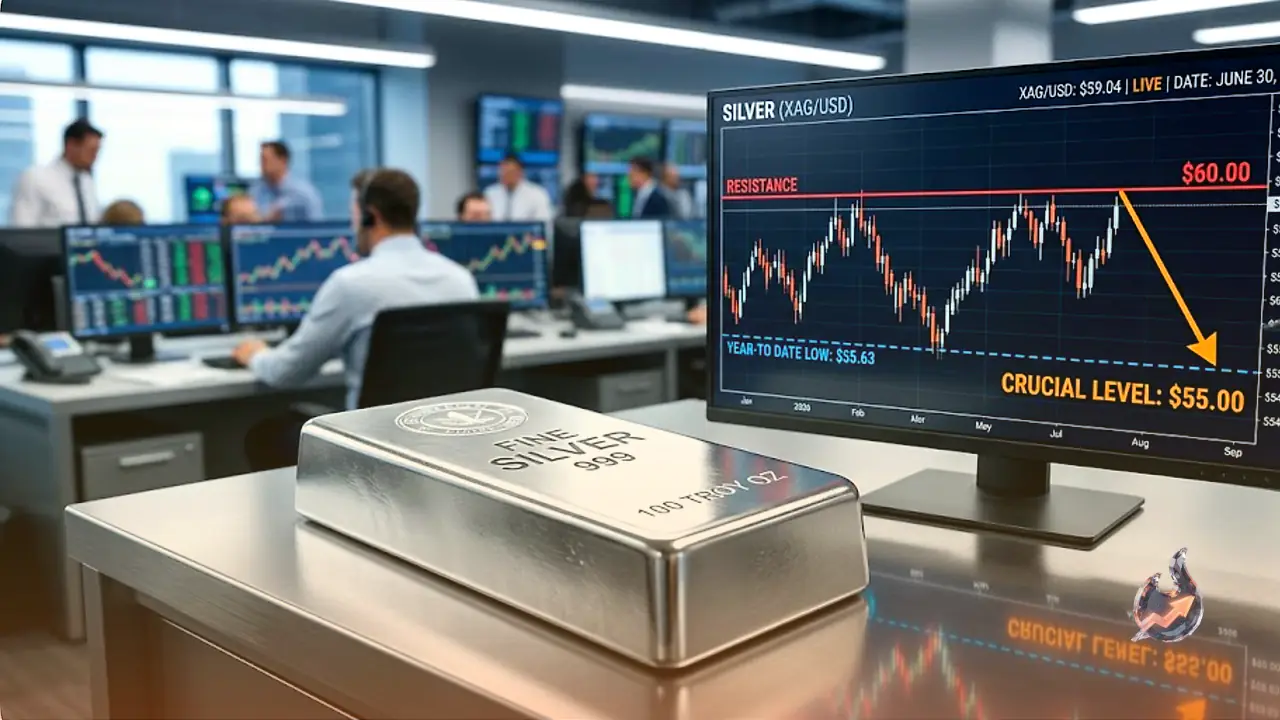

Silver looks well and truly stuck. The precious metal is grinding sideways below the $60.00 mark, unable to push higher yet refusing to deliver a clean breakdown, and traders betting on further weakness now have a single number locked in their sights: $55. In live trading on June 30, 2026, silver (SI=F) changed hands near $59.04, up 1.50% from the previous close of $58.17. Despite that modest bounce, the broader setup still leans bearish.
The core problem is that silver cannot clear the barriers on either side. Overhead sits the $60.00 psychological level, while the year-to-date (YTD) low of $55.63 lurks just below. As long as price swings between those two markers, the market stays trapped in indecision.
Momentum still favours the bears
The technical picture points to a downward tilt. The Relative Strength Index (RSI) is showing weakness and is close to slipping into oversold territory. Live readings put the 14-day RSI at 32, reinforcing the selling pressure. The MACD is also flashing a bearish signal, sitting below its signal line.
The downside map: where silver could pause
For the bearish move to extend, XAG/USD must first break the day's low of $56.61. A slide beneath that opens the door to the YTD low at $55.63, followed by the $55.00 handle. A decisive break there would expose the November 13 daily high that has since turned into support at $54.39. Lose that, and the next stop is a tumble toward $50.00 per troy ounce.
What the bulls need to turn it around
On the other side, any genuine recovery hinges on buyers reclaiming the March 23 swing low that has flipped into resistance at $61.01. Only once that hurdle is cleared can traders aim for the 200-day Simple Moving Average (SMA) at $69.72, ahead of the larger $70.00 milestone. Live data shows a 52-week range stretching from $35.85 to $121.30, a reminder of just how far the metal has fallen from its peak. Recent volume ran at roughly 9.17 times the 20-day average, signalling unusually heavy activity.
What silver is, and why investors hold it
Silver is a precious metal heavily traded among investors. For centuries it has served as a store of value and a medium of exchange. Although it is less popular than Gold, traders still turn to silver to diversify a portfolio, for its intrinsic value, or as a possible hedge during high-inflation periods. Investors can buy physical silver in coins or bars, or trade it through vehicles such as Exchange Traded Funds, which track its price on international markets.
The forces that move the price
Silver prices respond to a wide range of factors. Geopolitical instability or fears of a deep recession can lift silver thanks to its safe-haven status, though typically less than Gold. Because silver pays no yield, it tends to rise when interest rates fall. Its moves also depend heavily on the US Dollar, since the metal is priced in dollars (XAG/USD): a strong Dollar tends to cap silver, while a weaker Dollar usually pushes prices up. Investment demand, mining supply (silver is far more abundant than Gold) and recycling rates all play a part too.
An industrial metal in high demand
Silver is widely used across industry, especially in electronics and solar energy, because it has one of the highest electrical conductivities of any metal, even higher than Copper and Gold. A surge in demand can drive prices up, while a slowdown drags them down. Activity in the US, Chinese and Indian economies adds to the swings: the large industrial sectors of the US and particularly China consume silver in many processes, while in India consumer demand for jewellery is a key price driver.
Silver's tie to Gold
Silver tends to track Gold's movements. When Gold rallies, silver usually follows, since both share safe-haven status. The Gold/Silver ratio, which shows how many ounces of silver equal the value of one ounce of Gold, helps gauge the relative value of the two metals. Some investors read a high ratio as a sign that silver is undervalued or Gold overvalued, while a low ratio suggests the opposite, that Gold is cheap relative to silver.