























The headline figures of India's economic growth often present a glittering image of rapid expansion, especially at a time when the global economy is struggling with escalating geopolitical tensions, trade disputes, and supply chain disruptions. On paper, the recently announced Gross Domestic Product growth rate of 7.8% portrays the country as a powerhouse, reinforcing its status as the world's fastest-growing major economy. However, this impressive macroeconomic indicator stands in sharp contrast to the daily struggles of ordinary citizens. The disconnect between a booming growth rate and stagnant household finances raises critical questions about who is actually benefiting from this expansion.
The Diverging Interpretations of Macroeconomic Data
The announcement of the 7.8% GDP growth rate has triggered intense debate among economists, policymakers, and financial experts. Some commentators argue that the headline numbers do not accurately reflect the actual state of the domestic economy. For instance, Subhash Chandra Garg, who has served as the Finance Secretary of India, expressed strong skepticism regarding these statistics. Garg suggested that the country's actual economic growth was closer to 2.6%, dismissing the official 7.8% figure as statistically meaningless due to calculation anomalies and technical adjustments.
Similarly, Raghuram Rajan, the former Governor of the Reserve Bank of India, raised fundamental questions about the nature of this growth. Rajan pointed out a puzzling mismatch in the economic indicators. He noted that if the national economy is indeed expanding at a rate exceeding 7%, there should be a corresponding surge in corporate investments and foreign capital inflows. However, because both private investment and foreign institutional funding have remained persistently weak, Rajan concluded that something is fundamentally off with the economic picture. This ongoing debate suggests that the headline growth might be masking deeper structural weaknesses in the Indian economy.
A Comparative Look at Per Capita Wealth
While the overall size of India's economy is expanding, the individual prosperity of its citizens remains remarkably low on the global stage. According to estimates released by the International Monetary Fund, India's per capita income is currently valued at approximately $2,813. When converted into local currency, this amounts to an annual income of Rs 269,520.60 per person, which translates to a modest daily average of around Rs 738.41.
This average income appears significantly lower when compared to other nations, even those with much slower GDP growth rates. For example, Singapore, which recorded a growth rate of 5.9%, boasts an astronomical per capita income of $107,758. Similarly, Indonesia has an average growth rate of 5.29% but maintains a per capita income of $5,362. Even neighboring Bangladesh, despite expanding at a slower pace of 4.7%, has managed to achieve a higher per capita income of $2,911 per person. These figures highlight that high economic growth does not automatically translate into wealth for the average citizen.
The Escalating Burden of Kitchen Budgets
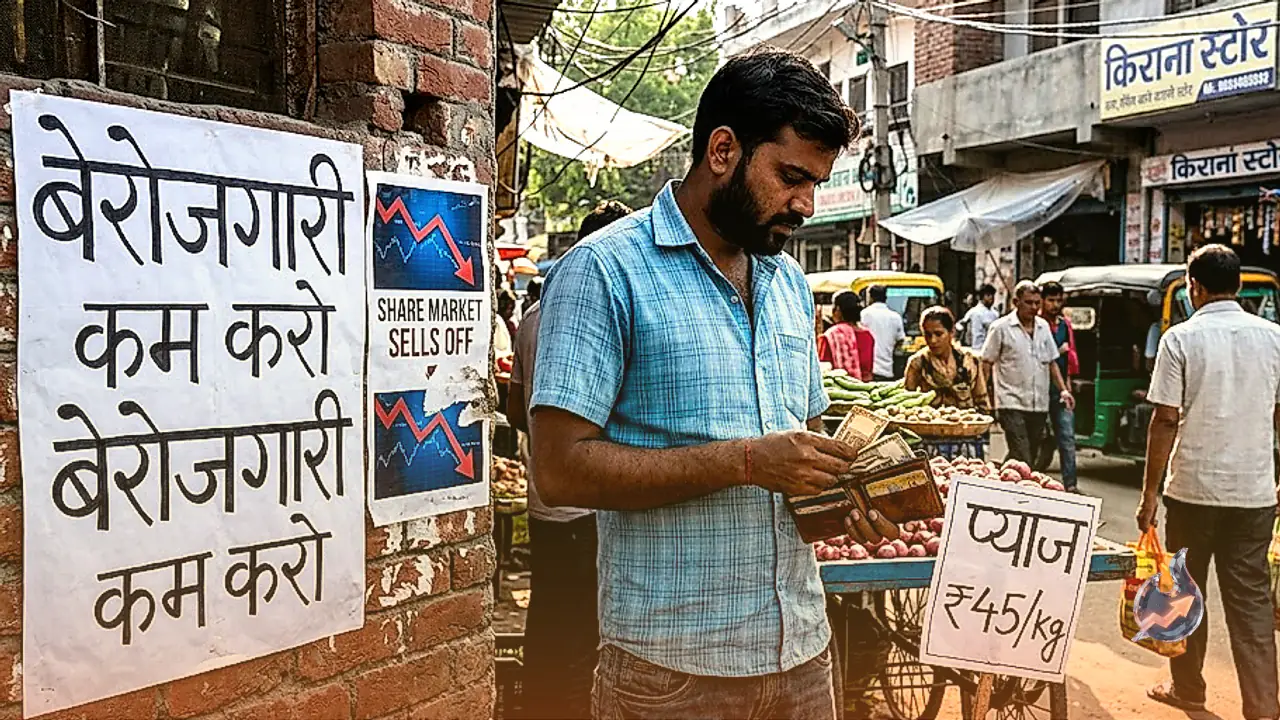
The most immediate pressure on Indian households comes from the rising cost of basic food items. In August, vegetable prices in retail markets experienced a massive surge of 40% to 50% just ahead of the festive season, stretching household budgets to their limits. The price gap between wholesale markets (mandis) and retail outlets highlights the heavy premium paid by end consumers for everyday staples like potatoes and onions.
Potatoes, a core ingredient in almost every Indian kitchen, are being sold in wholesale mandis for Rs 12 per kilogram, but the price jumps to Rs 20 per kilogram by the time they reach retail markets. The situation is even more severe for onions, where retail prices have soared to between Rs 75 and Rs 80 per kilogram, compared to wholesale rates of Rs 36 to Rs 45. Tomatoes follow a similar pattern, with retail prices ranging between Rs 40 and Rs 60 per kilogram, while wholesale prices hover between Rs 23 and Rs 25. Other vegetables also reflect this inflationary trend. Green beans are retailing at Rs 50 to Rs 60 per kilogram, and brinjals are priced at Rs 40 to Rs 60. Cabbage, which costs Rs 15 per kilogram in wholesale mandis, is sold to retail consumers for around Rs 40, while cauliflower prices have climbed to Rs 60 to Rs 80 per kilogram from a wholesale base of Rs 30.
The inflationary pressure is not limited to fresh produce. Sugar prices have also experienced a dramatic rise, reaching Rs 70 per kilogram last month, which represents a 30% to 40% increase. At the wholesale quintal level, sugar prices surged by more than 80% in less than two months, a spike driven primarily by severe supply constraints. To stabilize domestic availability and control rising prices, the Indian government had to halt exports and transition to importing sugar from international markets. These cumulative factors led to food and beverage inflation reaching 5.95% in August 2026, directly impacting the purchasing power of the population.
Rising Costs of Services and the Erosion of Savings
Beyond the kitchen, the cost of various services has also risen, adding to the general inflationary pressure. Consumer prices for services at restaurants and accommodation facilities grew by 8.38%. Furthermore, personal care, social protection, and miscellaneous goods and services witnessed a substantial increase of 15.17%, while transportation inflation rose to 4.6%. These rising costs mean that everyday living expenses are escalating across multiple sectors simultaneously.
At the same time, the returns that citizens receive on their hard-earned savings are failing to keep pace with these rising costs. Currently, public sector and private banks are offering interest rates on one-year fixed deposits in the range of 6.10% to 6.50%. The true value of these savings can only be measured when adjusted against inflation. For instance, if an investor secures a fixed deposit rate of 6.50% and subtracts the August inflation rate of 4.82%, the actual real return on their investment is a mere 1.68%. This nominal return is reduced even further after accounting for Tax Deducted at Source on the interest income, meaning that the purchasing power of savings is actually shrinking for many depositors.
Equity Market Corrections and Foreign Capital Flight
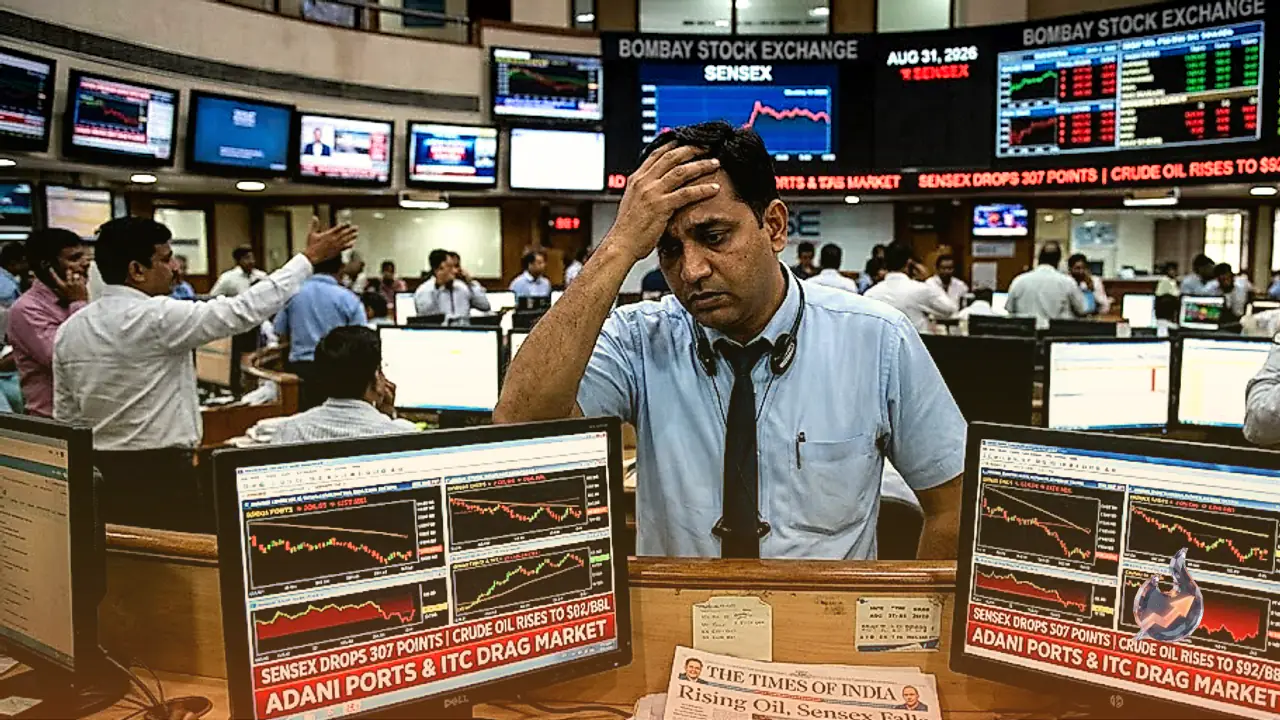
While bank deposits offer low real returns, the stock market has also failed to provide a reliable alternative for wealth generation recently. The benchmark Sensex index has declined by 13.3% on a year-to-date basis and is down nearly 9% compared to the same period last year. When measured from its historic high of 86,159.02 points recorded in December 2025, the index has experienced a sharp correction of 14.23%. The Nifty 50 has followed a very similar downward trajectory, falling 11.50% year-to-date, dropping 7% year-on-year, and declining 12.3% from its lifetime high of 26,373.20 points.
This prolonged downturn has also impacted India's standing in global financial markets. India was previously recognized as the world's fourth-largest stock market, but it has now slipped to the seventh position, with Taiwan and South Korea climbing to the fifth and sixth ranks, respectively. A major driver of this decline has been the consistent selling activity by foreign institutional investors, who have been net sellers in Indian equities since 2021. Outflows from these foreign funds exceeded Rs 3 lakh crore in both 2024 and 2025. This selling pressure accelerated further in 2026, with capital outflows reaching a record high of Rs 373,891 crore in less than nine months, indicating a potential shift in foreign investor confidence.
The Growing Challenge of Home Ownership
As investment returns decline, the cost of maintaining basic shelter has risen sharply, making affordable housing increasingly out of reach in major metropolitan areas. According to the Affordability Index compiled by Knight Frank for the first half of 2026, only six out of the eight major cities in India remained within the designated affordability threshold. This threshold is defined by an Equated Monthly Installment to income ratio of 50%, with any ratio above this limit considered a heavy financial strain.
In the financial capital of Mumbai, the EMI-to-income ratio reached a challenging 69%, while the capital region of Delhi-NCR stood closely behind at 67%, both far exceeding the comfortable threshold. This burden is particularly acute for low-income households. Data from 2025 indicates that the EMI-to-income ratio for the Economically Weaker Sections rose from 43% in 2020 to 60% in 2025, representing a substantial 17-percentage-point increase. For middle-income households, this ratio rose from 28% to 40% over the same five-year period. At the same time, the actual supply of affordable housing has shrunk dramatically, falling from 52.4% of total inventory in 2018 to just 17% in 2025 across the top eight cities, forcing buyers to overextend their finances to secure a home.
Labor Market Strains and Technical Layoffs
The state of the labor market also presents a mixed picture. India's overall unemployment rate saw a marginal improvement in August, falling to 5% from 5.1% in July. This marginal drop was primarily driven by rural areas, where unemployment fell from 4.5% to 4.1%, marking its lowest level since December. In contrast, urban unemployment moved in the opposite direction, increasing from 6.7% to 6.8%, reflecting the ongoing struggle for steady jobs in cities.
Overall employment indicators have shown very little upward momentum. The national employment rate inched up by just 0.6 percentage points, moving from 52.2% in August of the previous year to 52.8% this year. Similarly, the labor force participation rate rose by a mere 0.2 percentage points, from 55.4% to 55.6%. Although private-sector hiring recorded a 5% increase in August 2026, ending five consecutive months of contraction, it remained below the peak levels seen in February.
Furthermore, the rapid rise of artificial intelligence and automated technologies is putting severe pressure on the information technology sector, particularly on entry-level and junior positions. According to data tracked by TrueUp, the tech industry has witnessed extensive layoffs in 2026, with 622 companies reducing their workforce, affecting 190,058 employees. This equates to an average of approximately 709 tech workers losing their jobs every single day. Compounding these challenges is the high level of taxation, with India's maximum personal income tax rate standing at 39%, which is higher than Singapore's 24%, Indonesia's 35%, Bangladesh's 30%, and even the United States federal tax rate of 37%.