
























India's reported GDP growth rate of 7.8% presents an impressive picture on paper, especially at a time when the global economy is grappling with intense geopolitical tensions, escalating trade disputes, energy supply crises, and widespread fiscal instability. Being recognized as the fastest-growing major economy in the world is undoubtedly a powerful milestone. However, this high-octane growth figure stands in sharp contrast to the lived experience of ordinary citizens. For the average family, a persistent set of questions remains: if the economy is expanding so rapidly, why do kitchen budgets continue to stretch, why does inflation remain high, why does per capita income remain modest, and why is the job market failing to generate high-quality employment opportunities?
Debating the Legitimacy of the Growth Figures
The announcement of the 7.8% growth rate immediately triggered an intense debate among economists and policymakers. Subhash Chandra Garg expressed severe skepticism, asserting that the country's actual economic expansion was closer to 2.6%. He went as far as to describe the officially reported 7.8% figure as "statistically meaningless."
While Garg focused on technical and statistical discrepancies, Raghuram Rajan approached the issue from a fundamental macroeconomic perspective. Rajan pointed out a puzzling mismatch in the data: if the nation is indeed expanding at a rate exceeding 7%, why are corporate capital investments and foreign direct investments remaining so sluggish and disappointing? He summarized his skepticism by stating that "something is off" with the underlying economic alignment. These conflicting arguments emphasize a growing need to evaluate the true depth and strength of the economic foundation.
Global Comparisons and the Per Capita Income Gap
According to estimates compiled by the IMF, India's per capita income is approximately $2,813. This translates to an annual income of Rs 269,520.60 per person, which breaks down to about Rs 738.41 per day. For a country celebrated as a leading economic growth engine, these numbers remain exceptionally low when placed alongside other expanding nations.
For instance, Singapore has recorded a GDP growth rate of 5.9%, yet its per capita income stands at a massive $107,758. Similarly, Indonesia has registered a growth rate of 5.29%, but its per capita income is $5,362. Even more telling is the comparison with Bangladesh. Despite growing at a slower rate of 4.7%, Bangladesh has achieved a per capita income of $2,911, which is higher than India's per capita figure. This comparison highlights that rapid macro growth does not automatically guarantee high individual prosperity.
Kitchen Budgets and Skyrocketing Vegetable Prices
The daily struggles of the common citizen are most visible in the kitchen. In August, vegetable prices experienced a sudden and dramatic surge of 40% to 50% just ahead of the festive season, hitting household budgets severely. The price inflation of basic kitchen staples like potatoes and onions has been particularly painful, with prices nearly doubling as they move from wholesale yards to retail shop shelves. For example, potatoes that are sold at Rs 12 per kg in wholesale mandis end up costing consumers Rs 20 per kg in retail markets. Onions show an even wider gap; while wholesale prices range from Rs 36 to Rs 45 per kg, retail buyers are forced to pay between Rs 75 and Rs 80 per kg.
Other essential vegetables tell a similar story of pricing distress. Tomatoes, priced between Rs 23 and Rs 25 per kg in wholesale mandis, retail at Rs 40 to Rs 60 per kg. Green beans are retailing at Rs 50 to Rs 60 per kg, and brinjal is priced at Rs 40 to Rs 60 per kg. Cabbage, which costs just Rs 15 in the wholesale market, is sold for Rs 40 at retail, while cauliflower prices jump from Rs 30 wholesale to Rs 60 to Rs 80 per kg in retail markets.
The sugar market has faced similar disruptions. Last month, sugar prices climbed to Rs 70 per kg, representing a 30% to 40% hike. At the bulk quintal level, sugar prices surged by more than 80% in less than two months due to severe supply bottlenecks. To manage this domestic deficit, India had to reverse its policy, moving from exporting sugar to actively importing it from foreign markets. This compounding pressure pushed overall food and beverage inflation to 5.95% in August 2026.
Squeezed Lifestyles and Service Sector Inflation
The inflationary pressure is not limited to food. The cost of basic services has also been rising steadily, creating additional pressure on consumer spending. For instance, prices for services at restaurants and accommodation establishments rose by 8.38%. Furthermore, expenditures on personal care, social protection, and miscellaneous goods and services experienced a sharp hike of 15.17%. Transportation costs also moved upward, with inflation in this sector rising to 4.6%. These hikes mean that even when families try to cut back on food expenses, they are hit by rising expenses in commuting, personal maintenance, and dining out, leaving little room for discretionary savings.
Negative Savings Yields and Stock Market Correction
For citizens attempting to build a financial safety net, traditional saving mechanisms are offering limited relief. Currently, public sector (PSU) and private banks are offering interest rates on one-year fixed deposits (FD) in the range of 6.10% to 6.50%. However, the actual utility of these savings depends entirely on inflation. When we adjust the maximum FD rate of 6.50% against the August inflation rate of 4.82%, the real return is a tiny 1.68%. Once tax deducted at source (TDS) is applied to this interest income, the actual purchasing power of these savings shrinks even further.
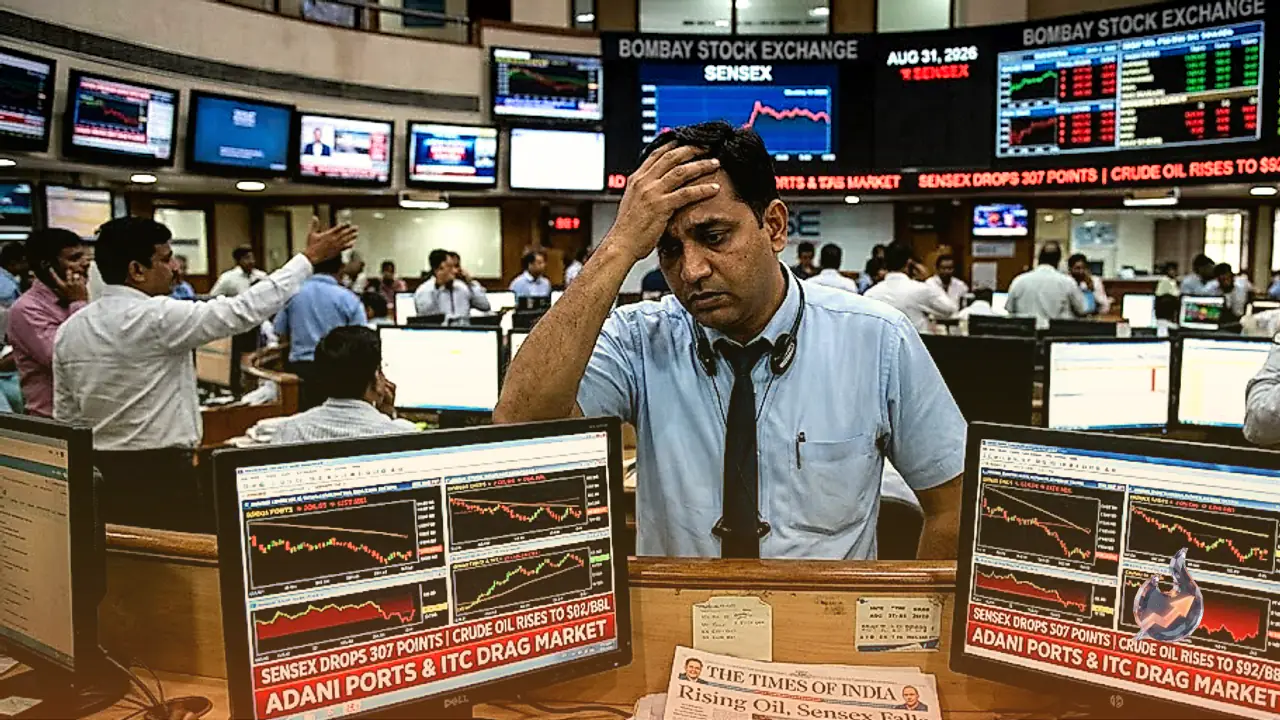
The equity markets have also failed to act as a reliable alternative for wealth generation recently. The Sensex has corrected by 13.3% on a year-to-date basis and is down by nearly 9% year-on-year. From its historic high of 86,159.02 points recorded in December 2025, the benchmark index has nosedived by 14.23%.
The Nifty index reflects a similar downward trajectory. The 50-share index has dropped 11.50% year-to-date, representing a 7% decline year-on-year and a 12.3% drop from its all-time high of 26,373.20 points. Consequently, India's stock market ranking globally fell from 4th to 7th place, with Taiwan and South Korea moving ahead to claim the 5th and 6th positions. A major factor behind this slump has been the persistent selling by foreign institutional investors (FIIs), who have been net sellers since 2021. FII outflows exceeded Rs 3 lakh crore in both 2024 and 2025, before setting a record outflow of Rs 373,891 crore in less than nine months of 2026, raising concerns about foreign investor confidence in India's valuation levels.
The Housing Affordability Barrier and Growing Debt
The dream of owning a home is also slipping away for many, as debt capacity stretches to its limits. In key urban centers like Mumbai and the Delhi-NCR, affordable housing is becoming increasingly out of reach. According to the Knight Frank Affordability Index for H1 2026, six out of eight major cities remained within the affordability threshold, which is defined as an EMI-to-income ratio of 50% or less. However, Mumbai recorded a ratio of 69%, while Delhi-NCR stood at 67%, both far exceeding this threshold.
This burden is exceptionally heavy for economically weaker sections (EWS). Knight Frank's data from 2025 shows that the EMI-to-income ratio for EWS households climbed from 43% in 2020 to 60% in 2025, representing a 17 percentage point increase. For middle-income households, this ratio rose from 28% to 40%, marking an 11 percentage point increase.
At the same time, the supply of affordable housing is shrinking rapidly. Across India's top eight cities, the share of affordable housing in total new launches fell from 52.4% in 2018 to just 17% in 2025. This leaves low-income households dedicating a massive chunk of their earnings to debt, or being priced out of the housing market entirely.
Unemployment Pressures and Tech Sector Layoffs
While the national unemployment rate dropped marginally to 5% in August from 5.1% in July, this improvement was driven entirely by rural areas, where unemployment fell from 4.5% to 4.1% (the lowest since December). Conversely, urban unemployment worsened, rising from 6.7% to 6.8%. The broader jobs market is growing at a highly sluggish pace. The overall employment rate inched up by just 0.6 percentage points, moving from 52.2% in August last year to 52.8% this year. Similarly, labor force participation grew by a tiny 0.2 percentage points, from 55.4% to 55.6%.
While private-sector hiring recorded a 5% increase in August 2026, breaking a five-month streak of declines, it still remains below its February high. In the technology sector, the rise of artificial intelligence (AI) and shifting corporate spending have put entry-level jobs under immense pressure. So far in 2026, the TrueUp tracker reports that 622 tech firms have laid off 190,058 employees, averaging about 709 layoffs every single day.
Compounding these challenges is a high tax regime. India's highest personal tax rate stands at 39%, which is significantly higher than Singapore's 24%, Indonesia's 35%, Bangladesh's 30%, and even the US federal income tax rate of 37%. This high tax rate further reduces the disposable income of skilled professionals, adding another layer of financial stress in a high-inflation environment.