



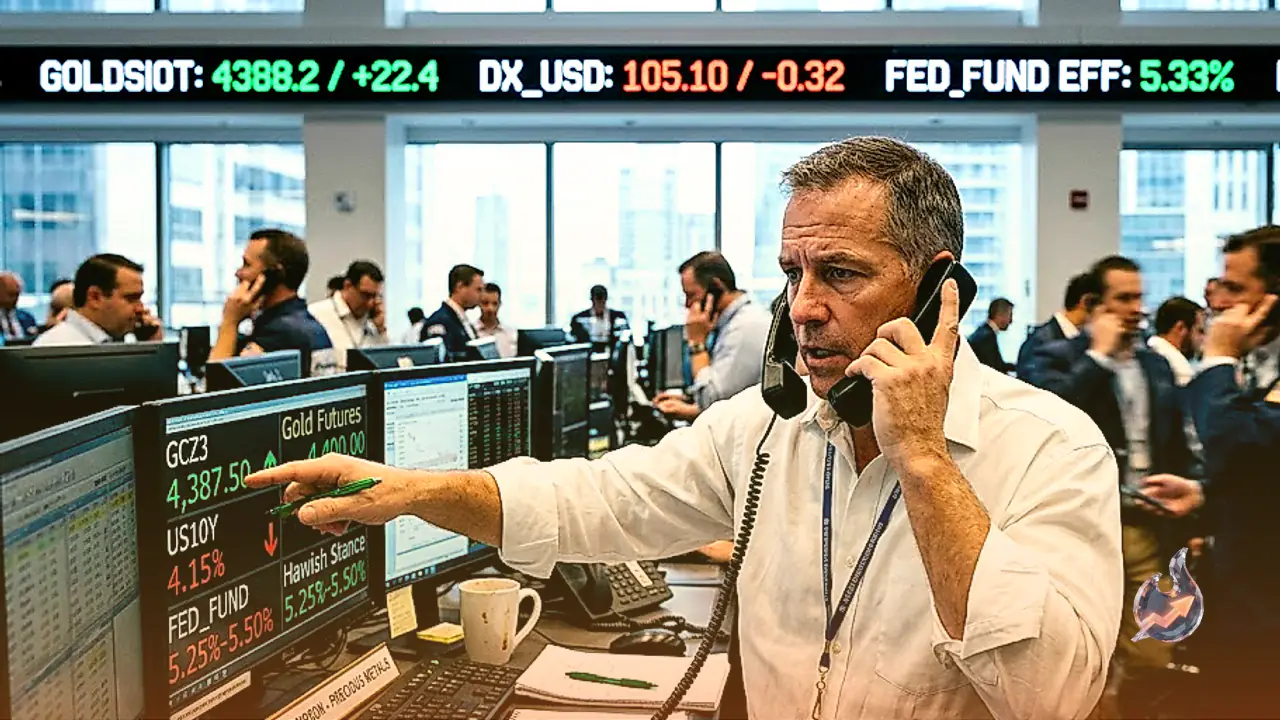





















Gold is on course to record a weekly advance after rebounding from its lowest point in more than a month. Positive developments surrounding crude oil distribution from Saudi Arabia have exerted downward pressure on petroleum benchmarks, helping US government bond yields ease off their recent highs and providing essential relief to bullion. Nevertheless, the Federal Reserve's hawkish policy path and its latest decision to raise borrowing costs continue to place a visible ceiling on the precious metal's upward momentum.
Federal Reserve Delivers Rate Increase as Dollar Firms
The trading week proved volatile for precious metals following monetary policy actions in the United States. The Federal Reserve raised the federal funds rate by 25 basis points on Wednesday, shifting the target range to 3.75%-4.00%. The move represented the central bank's initial rate hike since 2023. Financial markets reacted by driving the Greenback and Treasury yields upward, which triggered a steep pullback in bullion prices. The US Dollar Index (DXY), tracking the currency against a basket of six major international counterparts, advanced toward seven-week highs near 100.36.
Higher interest rates heighten the opportunity cost of maintaining holdings in non-yielding commodities such as bullion. Market participants actively tracking interest rate probabilities via the CME FedWatch Tool currently assign an approximate 55% likelihood to an additional rate increase at the upcoming October Federal Open Market Committee gathering. Until rate expectations stabilize, gold upside moves remain vulnerable to shifts in monetary commentary.
Saudi Pipeline Repairs Cool Petroleum Markets
The post-meeting drop in bullion values found counterbalancing support from a decline in international petroleum benchmarks. Crude prices softened following reports that Saudi Arabia is actively rerouting export volumes and conducting repairs on its East-West pipeline. The infrastructure had sustained damage during an attack the previous week. The East-West link serves as a strategic arterial route, enabling Saudi petroleum supplies to access the Red Sea terminals directly without navigating maritime traffic through the Strait of Hormuz.
While the repair progress offered immediate relief to energy supply chains and supported a pullback in sovereign debt yields, broader energy-driven inflationary threats persist. West Texas Intermediate (WTI) crude settled down approximately 0.63% near $96.00 per barrel approaching the weekend. Commercial maritime transit through the Strait of Hormuz continues under substantial operational constraints. Sustaining a wider gold rally will likely depend on deeper corrections in energy costs, extended drops in Treasury yields, or a definitive softening in the central bank's interest rate stance.
Technical Structure and Key Chart Thresholds
Examining the daily technical configuration reveals XAU/USD trading beneath the 20-period Simple Moving Average (SMA) of the Bollinger Bands at $4,422. This positioning keeps the prevailing short-term market bias tilted toward mild consolidation with bearish undertones. Indicator momentum appears indecisive: a negative Moving Average Convergence Divergence (MACD) alongside a subdued Average Directional Index (ADX) reading of 16 suggests that bullish breakout attempts are losing traction. Concurrently, a neutral Relative Strength Index (RSI) hovering near 51 reflects range-bound price action rather than decisive directional trending.
Looking at overhead price barriers, immediate technical resistance aligns at the middle Bollinger band near $4,422. Clearance above this hurdle exposes the psychological barrier at $4,500, followed by the upper boundary of the Bollinger envelope near $4,654. On downward swings, primary defensive support sits around the lower Bollinger band at $4,189. Should selling pressure accelerate further, a more definitive horizontal foundation awaits at $4,000, where buyers seeking long-term entry points are expected to establish stronger support.
Real-time market metrics place gold futures at $4,425, registering a 0.57% advance against the preceding close of $4,400. The asset has traversed a 52-week trading envelope spanning $3,664 to $5,586, with market volume currently tracking at 0.90 times its 20-day mean. Technical indicators confirm the range-bound setup: the 14-period RSI reads at 50, while MACD registers -1.38 against a signal line of 19.46, creating a bearish histogram value of -20.83. In the moving average complex, the 20-period EMA stands at $4,430, the 50-period EMA at $4,393, and the 200-period EMA at $4,426, with the 50-day EMA positioned below the 200-day EMA in a death cross alignment. The 20-period Bollinger Bands bracket between $4,255 and $4,729 around a $4,492 midline. An ADX value of 17 highlights weak trend strength, while the Stochastic oscillator displays a fast line at 53 against a signal line of 37. The Average True Range (ATR) of 108.68 defines current daily volatility parameters for risk management. Crucial intraday levels establish the pivot at $4,412, upward resistance checkpoints at R1 ($4,452) and R2 ($4,480), alongside downside support levels at S1 ($4,385) and S2 ($4,345).
Central Bank Accumulation and Safe-Haven Appeal
Across economic history, gold has functioned as an enduring medium of trade and wealth preservation. Beyond jewelry fabrication and industrial utility, the metal retains universal standing as an essential safe-haven asset during geopolitical friction and financial distress. Because bullion is not tethered to the balance sheet or creditworthiness of any sovereign government or corporate entity, it provides a trusted shield against currency debasement and general price inflation.
Official monetary institutions constitute the largest aggregate holders of gold globally. To reinforce domestic currency credibility and diversify foreign reserve portfolios during volatile periods, central banks continuously acquire physical reserves. Solid gold balances enhance global perceptions of a sovereign's solvency. Data published by the World Gold Council shows central banks accumulated 1,136 metric tons of bullion valued at approximately $70 billion in 2022. That volume marked the highest annual total recorded since systematic documentation began. Central banks representing major emerging market nations, notably China, India, and Turkey, have been particularly proactive in expanding their sovereign vaults. Over extended investment horizons, robust official reserve demand, private retail uptake, and sustained capital allocations into gold-backed exchange-traded funds provide enduring structural support to prices.
Macro Correlations Across Currencies and Risk Assets
Gold maintains an established inverse relationship with both the US Dollar and US Treasury securities, which serve as competing global reserve mechanisms. When the dollar encounters devaluation pressures, bullion typically appreciates, giving multinational entities and private investors a venue to protect capital during times of turmoil. Bullion prices likewise display an inverse dynamic relative to risk-weighted assets. Broad rallies across equity markets often redirect liquidity away from gold, whereas abrupt sell-offs in speculative sectors regularly drive institutional flows toward the precious metal.
The valuation trajectory of gold responds to diverse macroeconomic variables. Mounting geopolitical tension or the prospect of severe economic downturns can spur swift safe-haven accumulation. Conversely, as an asset that yields no coupon or dividend, gold typically prospers in low-interest-rate environments and faces headwinds when the cost of capital escalates. Daily price action continues to be governed by fluctuations in the value of the US Dollar (XAU/USD). A strengthening dollar curbs bullion gains, while dollar depreciation reliably offers tailwinds to metal quotations.
Foreign Exchange Crosses and Global Policy Divergence
Cross-currency markets reflect shifting central bank stances worldwide. The AUD/USD pair held gains above 0.7100 across Friday's Asian trading window, logging its second successive session of positive movement as declining US sovereign yields subdued dollar advances. Supportive remarks from Reserve Bank of Australia Governor Bullock regarding interest rates further bolstered domestic rate hike projections and lent stability to the Australian Dollar. Nonetheless, persistent hawkish messaging from the Federal Reserve alongside broader geopolitical uncertainties restricted overall dollar declines, capping the currency pair's upward scope.
Concurrently, the USD/JPY pair resumed upward movement in European trading, touching fresh two-week highs near 158.00. The Japanese Yen experienced renewed downward pressure despite the Bank of Japan executing an anticipated policy rate increase to 1.25% alongside firm statements from Governor Ueda. Market sentiment on the currency was weighed down by two unexpected dissenting votes opposing the tightening measure. For more than a decade, Japan maintained ultra-loose monetary policies that funded trillions of dollars in worldwide investments, establishing the yen as an essential low-cost funding mechanism. As the Bank of Japan steps toward normalized policy settings, that long-standing dynamic enters a transitional phase.
Cryptocurrency Rebound and Market Outlook
Digital asset markets have also experienced a notable recovery. Bitcoin staged a strong rebound after dropping to a yearly low of $57,800 in July, climbing roughly 33% and logging back-to-back monthly advances across July and August. Despite that recovery, Bitcoin remains approximately 40% below its historical peak valuation. Market observers continue to debate whether this upward movement represents the foundation of a renewed bull market or an interim correction within an overarching cyclical downturn.
For gold market participants, near-term direction hinges on establishing a sustainable foothold above the $4,400 threshold through late-week European and US sessions. With receding Treasury yields restraining aggressive dollar appreciation, upcoming scheduled remarks from Federal Reserve policymakers and incoming economic reports will dictate whether bullion extends its weekly progress or faces renewed selling pressure under the weight of higher borrowing costs.