





















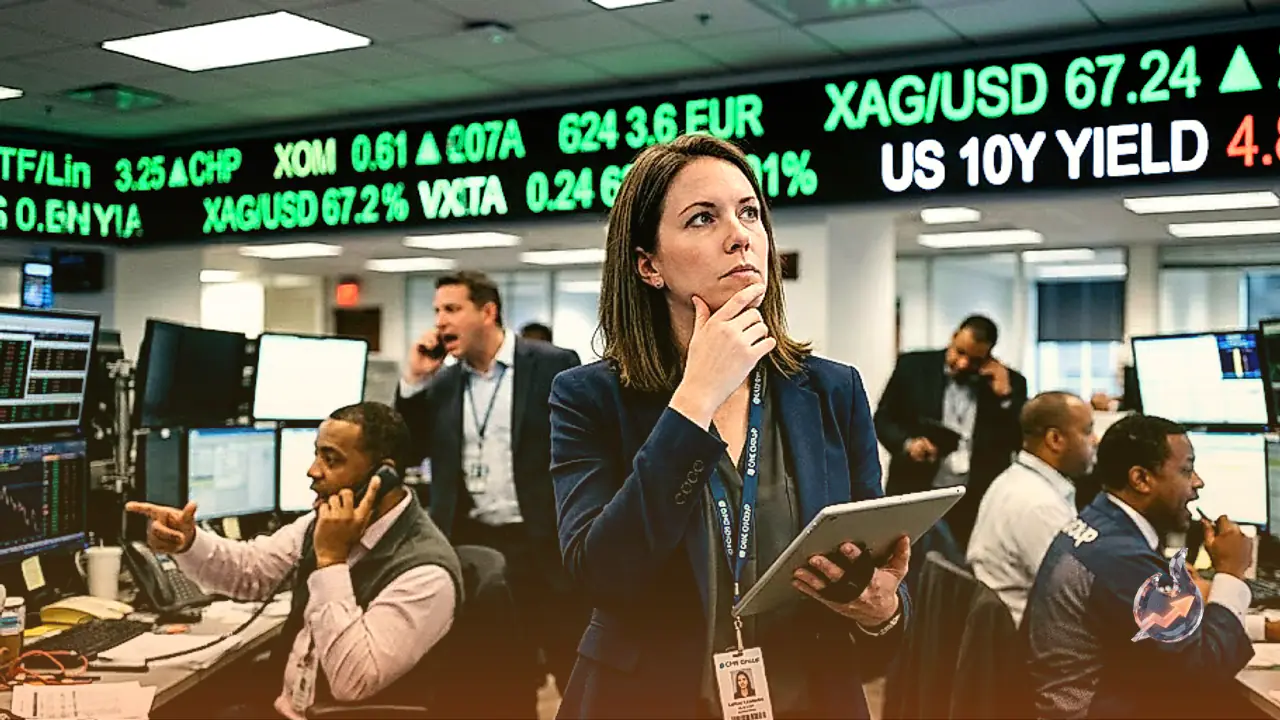

Precious metals are regaining strong upward traction across international commodity markets. After rebounding from the $62.00 area earlier in the week, spot silver (XAG/USD) pushed decisively above the $67.00 per ounce mark. The retreat of long-term United States Treasury yields from recent peaks has provided a significant tailwind for non-yielding assets, encouraging market participants to rebuild bullish exposure.
Retreating Bond Yields Fuel Precious Metals
The benchmark 10-year US Treasury yield pulled back below the psychological 5% threshold, triggering widespread relief across bond desks. While policy determinations initially lent support to the US Dollar by reaffirming institutional independence at the central bank, the easing of borrowing benchmarks created an immediate catalyst for non-yielding commodities. Because precious metals offer no regular coupon or interest payout, lower yields decrease the opportunity cost of holding them relative to debt securities.
Live tracking figures place silver around $66.56, marking a 1.66% gain over the prior close of $65.47. The commodity continues to navigate within a broad 52-week band bounded by $41.81 on the low end and $121.30 at its highest. Technical indicators place the 14-day relative strength index (RSI) at 55, pointing to stable momentum, while average true range (ATR) volatility stands at $1.73 per session.
Critical Technical Levels and Chart Formations
For buyers attempting to extend the current rally, the immediate challenge lies near the $68.00 zone. This price point corresponds directly to the peaks recorded on September 4 and September 9. Overcoming this hurdle would reopen the trajectory toward the mid-June and late-August swing highs above $71.00, placing the 200-day Simple Moving Average (SMA) at $73.18 firmly in the crosshairs of market technicals.
Conversely, downside risks remain present if buying momentum wanes. Session lows around $65.20 offer initial footing, but a sharper breakdown would bring the critical support shelf between $62.20 and $63.05 into focus. This zone marks the lower perimeter of the trading range that has confined price movement over the past two months. Furthermore, it functions as the decisive neckline of a developing bearish Head and Shoulders chart structure, where a failure to defend could provoke extended selling.
Industrial Dynamics and Regional Demand Channels
Beyond its traditional role as a safe haven, silver possesses distinct physical characteristics that anchor its valuation to global commerce. Possessing electrical conductivity superior to both copper and gold, the white metal is an indispensable component in electrical components, microelectronics, and photovoltaic solar hardware. Shifts in manufacturing activity directly influence total physical consumption, creating price adjustments alongside purely financial flows.
Regional economic patterns in the United States, China, and India play a decisive role in balancing physical supply and demand. Heavy manufacturing sectors across both the United States and China consume substantial volumes of refined metal for industrial fabrication. Meanwhile, consumer demand across India acts as a major pillar on the retail side, where jewellery purchases and cultural bullion accumulation regularly drive seasonal physical import demand.
Safe-Haven Status and Relative Valuations
Throughout financial history, silver has served as a reliable store of value and medium of trade. While gold commands higher visibility during crises, market participants frequently turn to silver to balance overall risk, protect capital against currency erosion during inflation, or capture higher percentage swings due to the metal's lower baseline valuation. Market access ranges from direct allocation in physical minted bars and bullion coins to liquid shares of exchange-traded funds that track real-time spot rates.
Price movement in silver regularly mirrors broader gold trends, albeit with higher typical volatility. Investors monitor the gold-to-silver ratio, which measures how many ounces of silver are required to match the purchasing power of a single ounce of gold, to gauge relative market imbalances. A historically high reading generally suggests silver is trading at an attractive discount relative to gold, whereas a declining ratio signals that gold may be underpriced in comparison.
Cross-Asset Movements in Currency and Crypto Spaces
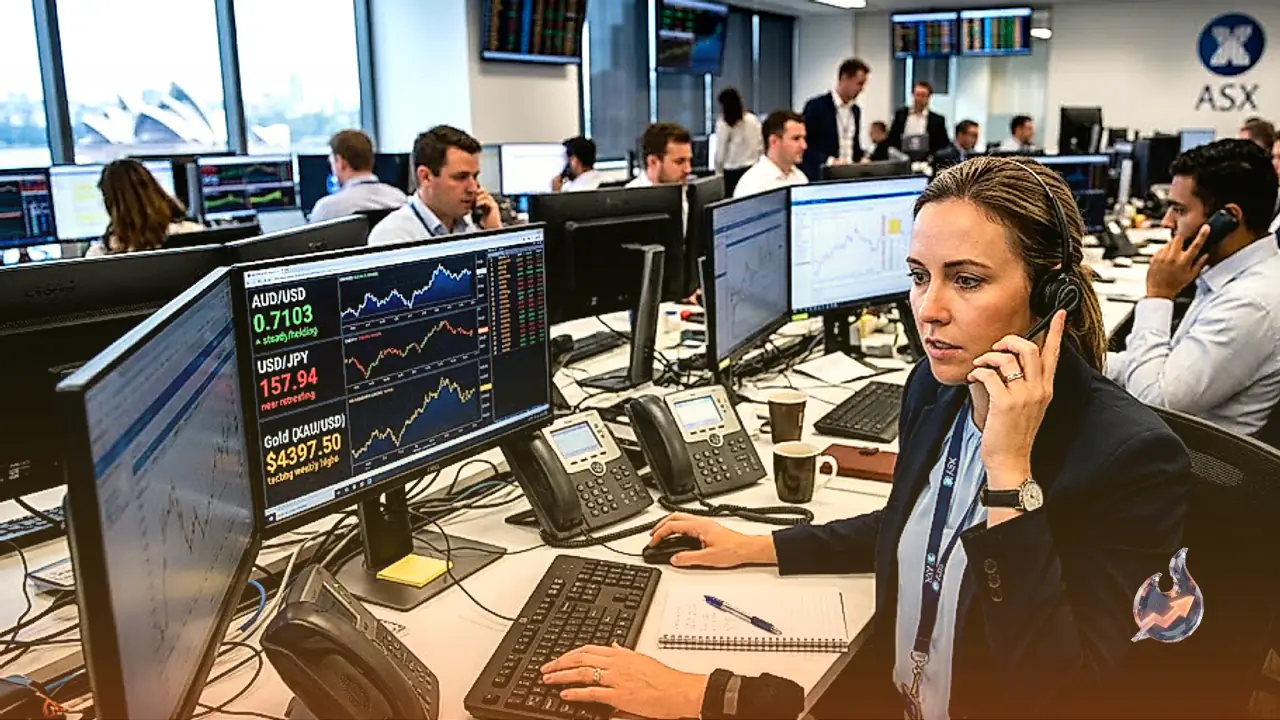
The broader macro environment reflects varied responses across asset classes to shifts in sovereign yields. The AUD/USD pair maintained a positive stance above 0.7100 during Friday's Asian trading, helped along by softer Treasury yields and policy commentary from Reserve Bank of Australia Governor Bullock regarding interest rates. Concurrently, USD/JPY pressed higher into the European session to test 158.00, continuing yen depreciation despite a Bank of Japan policy adjustment to 1.25% under Governor Ueda, as two dissenters clouded the outlook for further tightening.
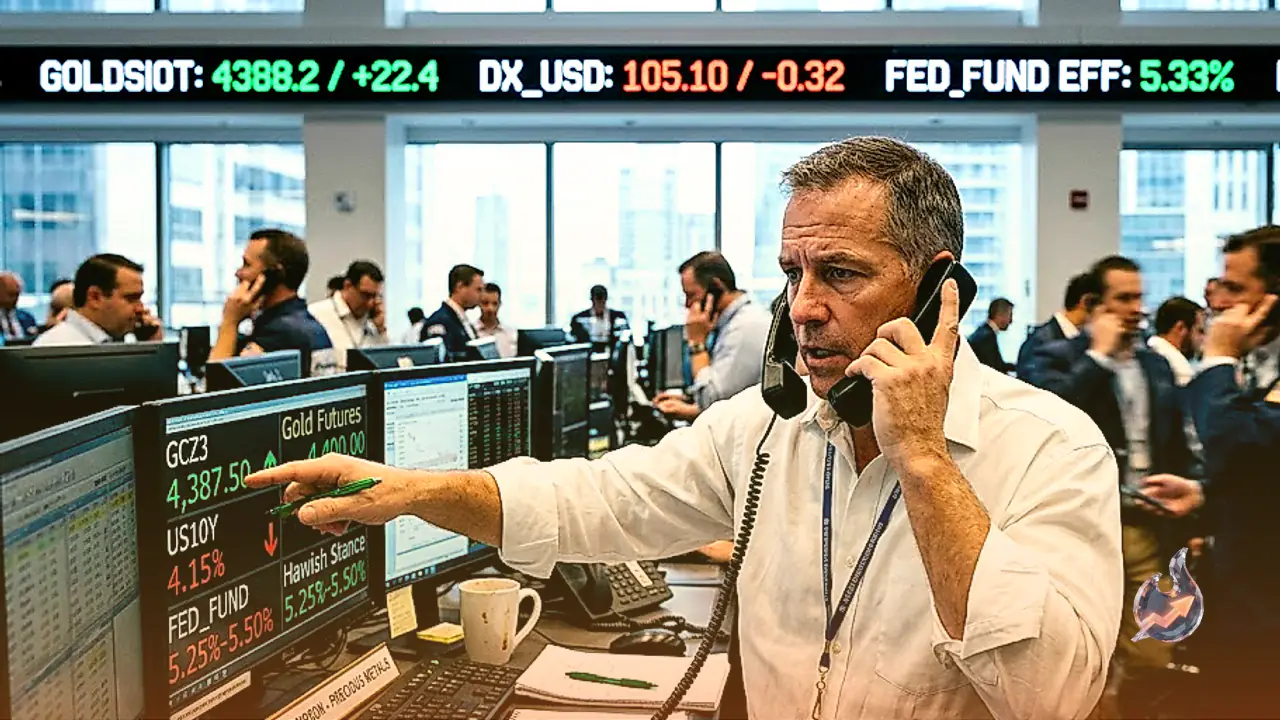
In alternative stores of value, Bitcoin (BTC) has rebounded roughly 33% from its July low of $57,800, logging consecutive monthly gains in July and August yet sitting roughly 40% under its historical summit. Spot gold pushed toward weekly highs as traders monitored progress toward $4,400, reinforcing broad-based demand across physical hedges as bond market dynamics continue to shift.