
























The dollar's advance pushed the Japanese yen lower after the Federal Reserve lifted its funds target range to 3.75%–4.00%. Expectations for additional tightening, inflation worries tied to oil prices, and Middle East risk all strengthened demand for the US dollar. Live close-bell data for 2026-09-16 put USD/JPY at 156.31, up 0.67% from 155.27, but the longer-term technical setup still showed meaningful resistance to a full trend reversal.
Policy outlook keeps pressure on the yen
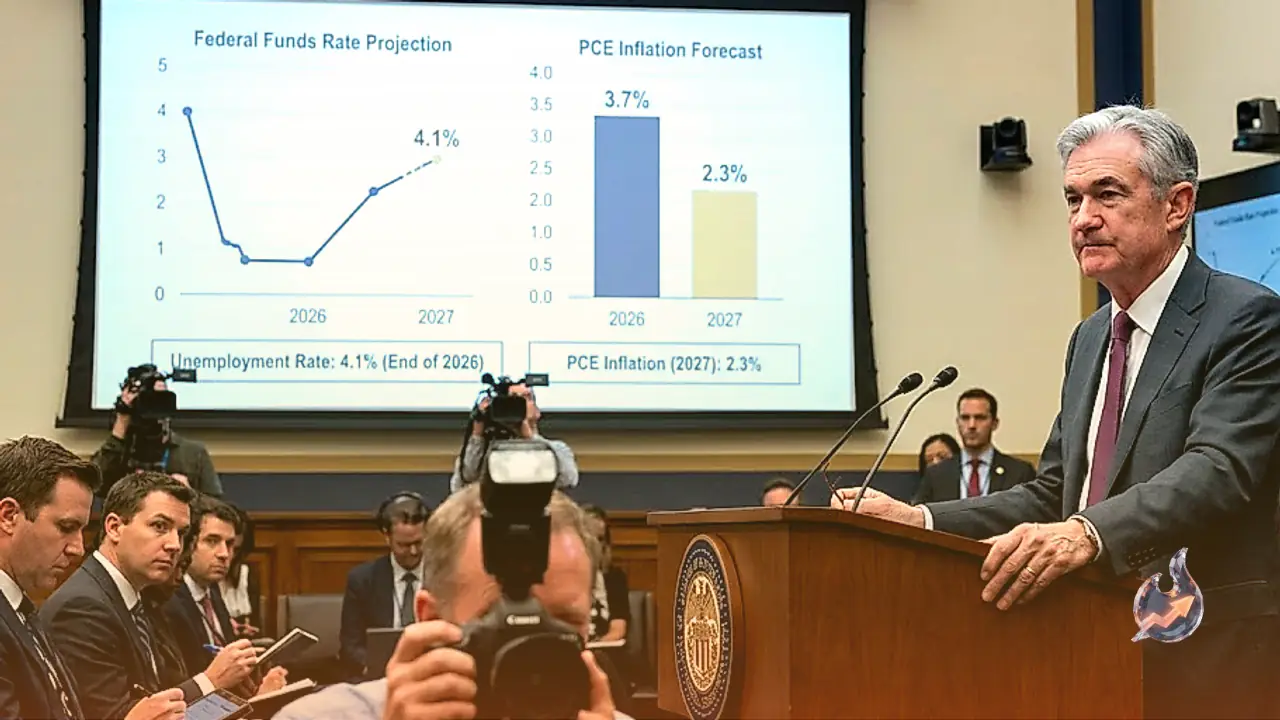
The increase amounted to 25 bps, leaving the funds target range at 3.75%–4.00%. Inflation continued to trouble policymakers, although they were more assured about economic growth. In currency markets, higher expected US returns can support dollar demand when compared with Japan's low-rate environment.
The Federal Open Market Committee's (FOMC) Summary of Economic Projections pointed to more tightening before year-end. Twelve of 18 officials expected one additional 25 bps increase, four anticipated two more hikes, and only two saw no further move this year. Further tightening therefore remained the central expectation, despite the lack of unanimity.
USD/JPY reflects both sides of the rate equation. The Fed has already acted, while the Bank of Japan is expected to tighten again during the coming week. Any change in the timing or scale of those decisions can therefore move demand for either currency quickly.
Live quote confirms stronger dollar demand
The close-bell reading placed USD/JPY at 156.31, compared with 155.27 at the previous close. The 0.67% rise put the pair at a fresh weekly high and preserved its positive short-term bias. Volume was 1.00x the 20-day average, while the live quote remained inside the 52-week range of 146.61–163.98.
During Wednesday's Asian trading, USD/JPY first moved above 155.00 and touched a new one-week high. Buyers then paused below the mid-155.00s while waiting for the Fed decision; the Bank of Japan meeting beginning Thursday was the other event on the calendar. The stronger close-bell reading showed that dollar demand won the session.
Technical signals point in different directions
Live calculations from the current quote show upward price action alongside unresolved longer-term pressure. USD/JPY is above its pivot, yet it sits below every moving average in the live set. The weekly gain therefore cannot be treated as a complete trend reversal.
- Moving averages: EMA20 is 156.49, EMA50 is 158.24, EMA200 is 157.62, SMA50 is 159.27, and SMA200 is 158.40. Price at 156.31 is below all five. The live setup classifies the market as a long-term downtrend even though EMA50 remains above EMA200 in a golden cross.
- Momentum: RSI(14) is 46. MACD reads -1.35 against a -1.30 signal, with a bearish -0.05 histogram, while the Stochastic fast line is 46 versus a 32 signal line. Short-term momentum has improved, but MACD has not produced a decisive positive crossover.
- Volatility: Bollinger(20,2) bands run from 152.03 to 162.00, with a midpoint of 157.02, and price is inside the bands. ATR(14) is 1.54 and is supplied as a daily-volatility stop-loss buffer, while ADX(14) at 45 indicates a trending market.
- Reference levels: The 20-day support is near 152.90 and resistance is near 160.38. The pivot is 155.85, with R1 at 156.88 and R2 at 157.45; S1 is 155.28 and S2 is 154.25.
Yields and geopolitical risk boosted the dollar
Inflation worries tied to oil prices and the expected Fed increase kept lifting US bond yields toward multi-year highs. Higher yields can improve the dollar's rate appeal, giving USD/JPY a firmer base even while its longer-term chart remains under pressure.
Middle East tensions favored the safe-haven dollar and weighed on the risk-sensitive Australian currency. Rising US-Iran tensions also reinforced the dollar's reserve-currency role. Those forces help explain why buyers remained active despite the pair's position below major moving averages.
AUD/USD and gold reflect the same pressure
Pressure persisted in AUD/USD for a third consecutive day. The pair defended 0.7100 and traded near a monthly low during Wednesday's Asian session, while the US dollar stood near a two-week high. Ahead of the decision, the expected Fed hike, oil-related inflation fears, and Middle East risk supported yields and hurt the risk-sensitive Aussie.
Gold's intraday advance disappeared after the Federal Reserve delivered the expected 25 bps increase. XAU/USD briefly surpassed $4,360, then its slide accelerated below $4,300. The reversal showed how quickly higher yields and a stronger dollar reduced appetite for gold.
Japan's low-rate funding advantage faces a test
For more than a decade, Japan's ultra-low interest rates financed trillions of dollars in global investments. That made the yen one of the world's cheapest funding sources and supported its use in international investment.
The Bank of Japan is now expected to tighten policy again this week, suggesting that the old funding advantage may be entering a new phase. Most major economies raised interest rates while Japan remained the global outlier. The coming policy shift is central to how much relief the yen can sustain against the dollar.
Levels that determine whether the rally lasts
The immediate upside references are 156.88 and 157.45, followed by 20-day resistance near 160.38. A sustained break through those barriers would be needed to ease the bearish pressure shown by the moving averages and bearish MACD reading.
On the downside, 155.85 is the pivot, followed by S1 at 155.28 and S2 at 154.25. The 20-day support near 152.90 sits farther below, while the full 52-week range remains 146.61–163.98. ADX(14) at 45 confirms a trending market, but the live indicators call for confirmation rather than treating one stronger session as a completed reversal.