
























Financial markets are experiencing heightened volatility as investors evaluate fresh US inflation data alongside changing expectations for Federal Reserve monetary policy. The US Dollar Index (DXY) has been consolidating recent gains while testing resistance around its 200-day moving average of 99.17. The release of the July Personal Consumption Expenditures (PCE) Price Index confirmed that price pressures remain persistent above the central bank's official 2% target, even as real consumer spending shows signs of stalling.
PCE Inflation Data Breakdown and Federal Reserve Expectations
The July PCE inflation figures presented a mixed picture for economic policymakers. Headline PCE rose 0.2% month-over-month, slightly ahead of the 0.1% consensus estimate and reversing the -0.1% reading recorded in June. On an annual basis, headline PCE inflation came in at 3.7%, matching the previous month's rate but exceeding the expected 3.6% mark. This represents the second consecutive month that headline inflation has remained at 3.7% year-over-year.
Core PCE inflation, which excludes volatile food and energy components, aligned with market expectations by advancing 0.2% month-over-month compared to 0.1% in June. The year-over-year core PCE measure held steady at 3.3% for a second straight month. Alternative inflation gauges further emphasized stability in underlying price trends: the Dallas Fed trimmed mean PCE was unchanged at 2.3% year-over-year, and the Cleveland Fed median PCE remained flat at 2.7% year-over-year.
Analyst Elias Haddad of Brown Brothers Harriman noted that while inflation remains elevated above target, its failure to accelerate rapidly combined with flat real spending gives the Federal Reserve flexibility to pause further rate hikes. However, this dynamics leaves the US Dollar susceptible to a dovish repricing if monetary policy shifts. Currently, Fed funds futures assign a 36% probability to a 25 basis point rate hike (targeting 3.75-4.00%) at the September 16 policy meeting, with cumulative tightening priced at 40 basis points over the next twelve months.
Foreign Exchange Reaction Across Major Currency Pairs
Currency markets reflected cautious trading ahead of upcoming macroeconomic catalysts. The GBP/USD pair rebounded from six-day lows to trade just under the 1.3600 technical barrier on Thursday. Market participants maintained a guarded stance ahead of Friday's economic data releases and the upcoming central bank commentary.
Similarly, EUR/USD trimmed earlier session losses to recover toward the mid-1.1600 level. Traders shifted focus toward Friday's Non-Farm Payrolls (NFP) revision figures and the scheduled speech by Federal Reserve Chair Kevin Warsh at the Jackson Hole Symposium.
Commodities, Corporate Earnings, and Cryptocurrency Trends
In precious metals, gold experienced continued selling pressure, extending Wednesday's decline to mark new weekly lows around $4,570 per troy ounce. The metal struggled to gain traction despite broader market uncertainty and range-bound trading in the US Dollar.
Conversely, equity market sentiment received support from technology sector strength. Nvidia Corp reported quarterly revenue and sales results that topped Wall Street expectations, underscoring ongoing demand within the artificial intelligence (AI) capital expenditure cycle.
Digital assets traded generally higher on Thursday. Bitcoin hovered near the $80,000 benchmark, boosting sentiment across altcoins. Ethereum held above $2,500, while Ripple maintained its position above key technical support at $1.40.
Energy Sector Dynamics and Crude Oil Technical Outlook
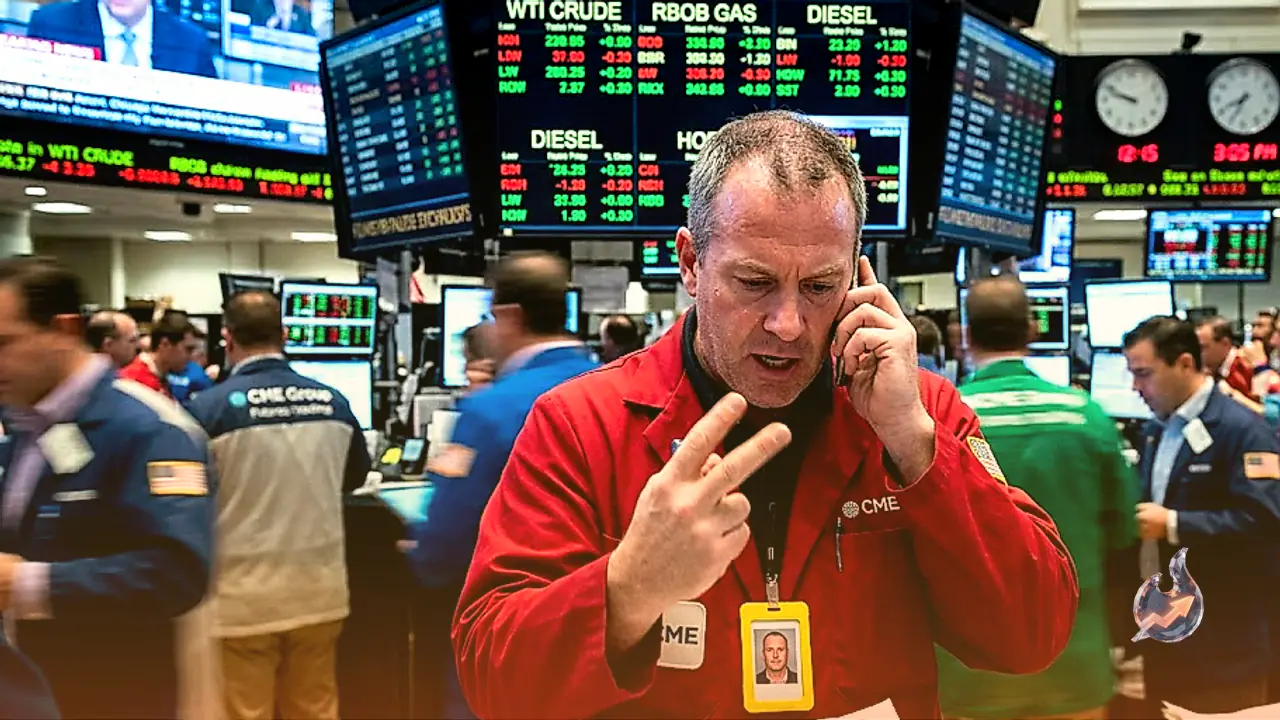
Energy markets displayed notable divergence between refined products and crude oil benchmarks. The US diesel crack spread, measuring the premium of ultra-low sulphur diesel futures over WTI crude, broke past $100 per barrel for the first time, reaching an intraday record high above $102.00. Meanwhile, Brent crude remained range-bound below $90 per barrel.
In live commodity markets, Crude Oil futures (CL=F) settled at $82.75, representing a 0.63% increase from the previous close of $82.23. The 52-week trading range spans $54.98 to $119.48. Technical indicators show the 14-day RSI at 50, while MACD registers at 0.82 against a signal line of 0.96 (histogram -0.14, indicating mild bearish momentum). Moving averages confirm a long-term uptrend characterized by a golden cross (EMA50 at $82.75 exceeding EMA200 at $75.97). The 14-day Average True Range (ATR) stands at 3.58. Key daily price levels include a pivot point at $82.07, support levels at S1 $81.33 and S2 $79.91, and resistance thresholds at R1 $83.49 and R2 $84.23.
Market Outlook Ahead of Chair Kevin Warsh's Jackson Hole Address
Attention is centered on Federal Reserve Chair Kevin Warsh as he prepares to deliver his inaugural Jackson Hole speech on Friday. Financial markets are closely watching for guidance that extends beyond the immediate September 16 interest rate decision, seeking clarity on long-term monetary policy strategy and inflation management.